Meta Andromeda - The ultimate guide to Meta Ads in 2026
March 10, 2026
If you run eCommerce ads on Meta, the algorithm you built your strategy around no longer exists.
In 2025, Meta replaced the core engine that decides which ads get shown to which people. They called it Andromeda. It wasn’t a tweak or an optimization; it was a complete rebuild of how ad retrieval works, introducing a 10,000x increase in model complexity at the stage where the system decides which ads even get a chance to compete.
The rollout completed globally in October 2025. Every single advertiser on Meta is now operating under Andromeda, whether they’ve adapted or not.
We wanted to understand what this actually means for eCommerce advertisers. Not in theory - in data.
So we studied it. Across 3,014 eCommerce advertisers using Confect, covering $834 million in ad spend, 1 million ads, and 115.7 billion impressions during the full 2025 rollout period.
What we found is both alarming and clarifying.
Alarming, because Andromeda has caused measurable declines in ROAS, conversion rates, and top-funnel efficiency; and the damage hit the best-performing advertisers the hardest.
Clarifying, because the data also shows exactly what separates the advertisers who are winning under Andromeda from those who are falling behind. The patterns are consistent, the gaps are large, and the path forward is concrete.
This ebook walks you through every major finding from the study: what changed, who got hit, why it’s happening, and what you can do about it, starting today.
Whether you’re a brand, an agency, or a retailer running Catalog Ads on Meta, this is the data you need to make better decisions in 2026.
Let’s get into it.
About This Study
$834 million in ad spend. 3,014 advertisers. One algorithm change.
This is not a report based on a handful of ad accounts or a few months of data from one agency.
The Confect Andromeda Study covers the full 2025 calendar year - from the pre-Andromeda baseline through the phased global rollout to full deployment - across 3,014 eCommerce advertisers in 73 countries.
Here’s the dataset at a glance:
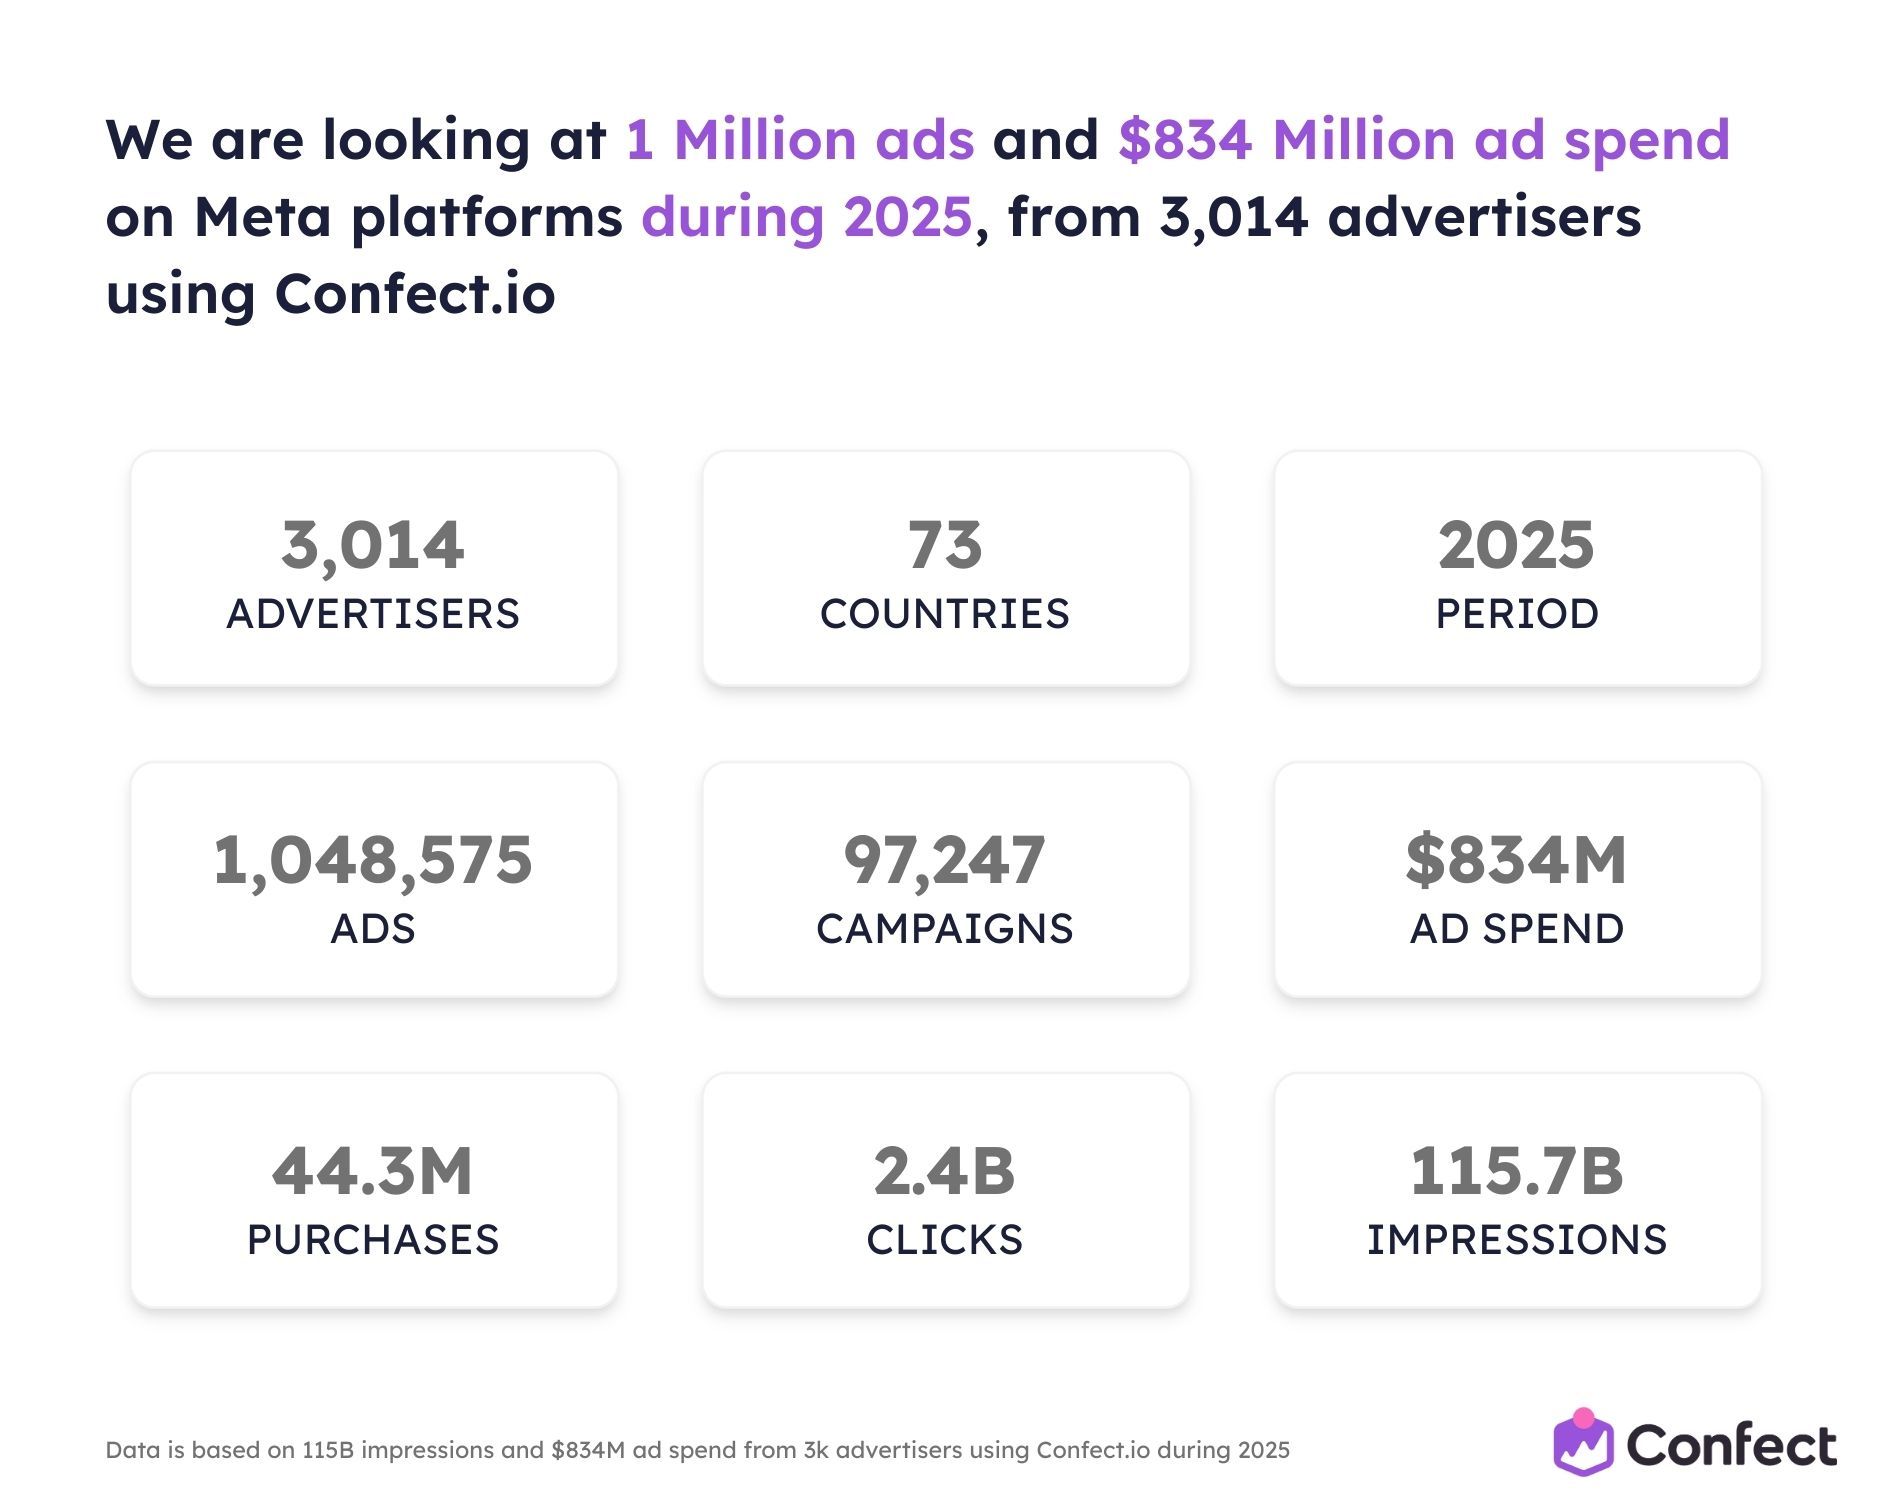
Every finding in this ebook is backed by these numbers. When we say ROAS declined by 7%, that’s across 115.7 billion impressions. When we say Catalog Ads outperform static ads by 23%, that’s measured across 44.3 million actual purchases. Not modeled estimates or survey data.
That matters, because most industry reports on Meta advertising are based on a few dozen accounts at best. This one covers over a million individual ad creatives.
Who are the 3,014 advertisers?
All advertisers in this dataset are eCommerce companies using Confect. They range from small shops spending under $34,000 a year on Meta to large retailers investing over $1,000,000 monthly in Conversion campaigns.
They are not a homogeneous group.
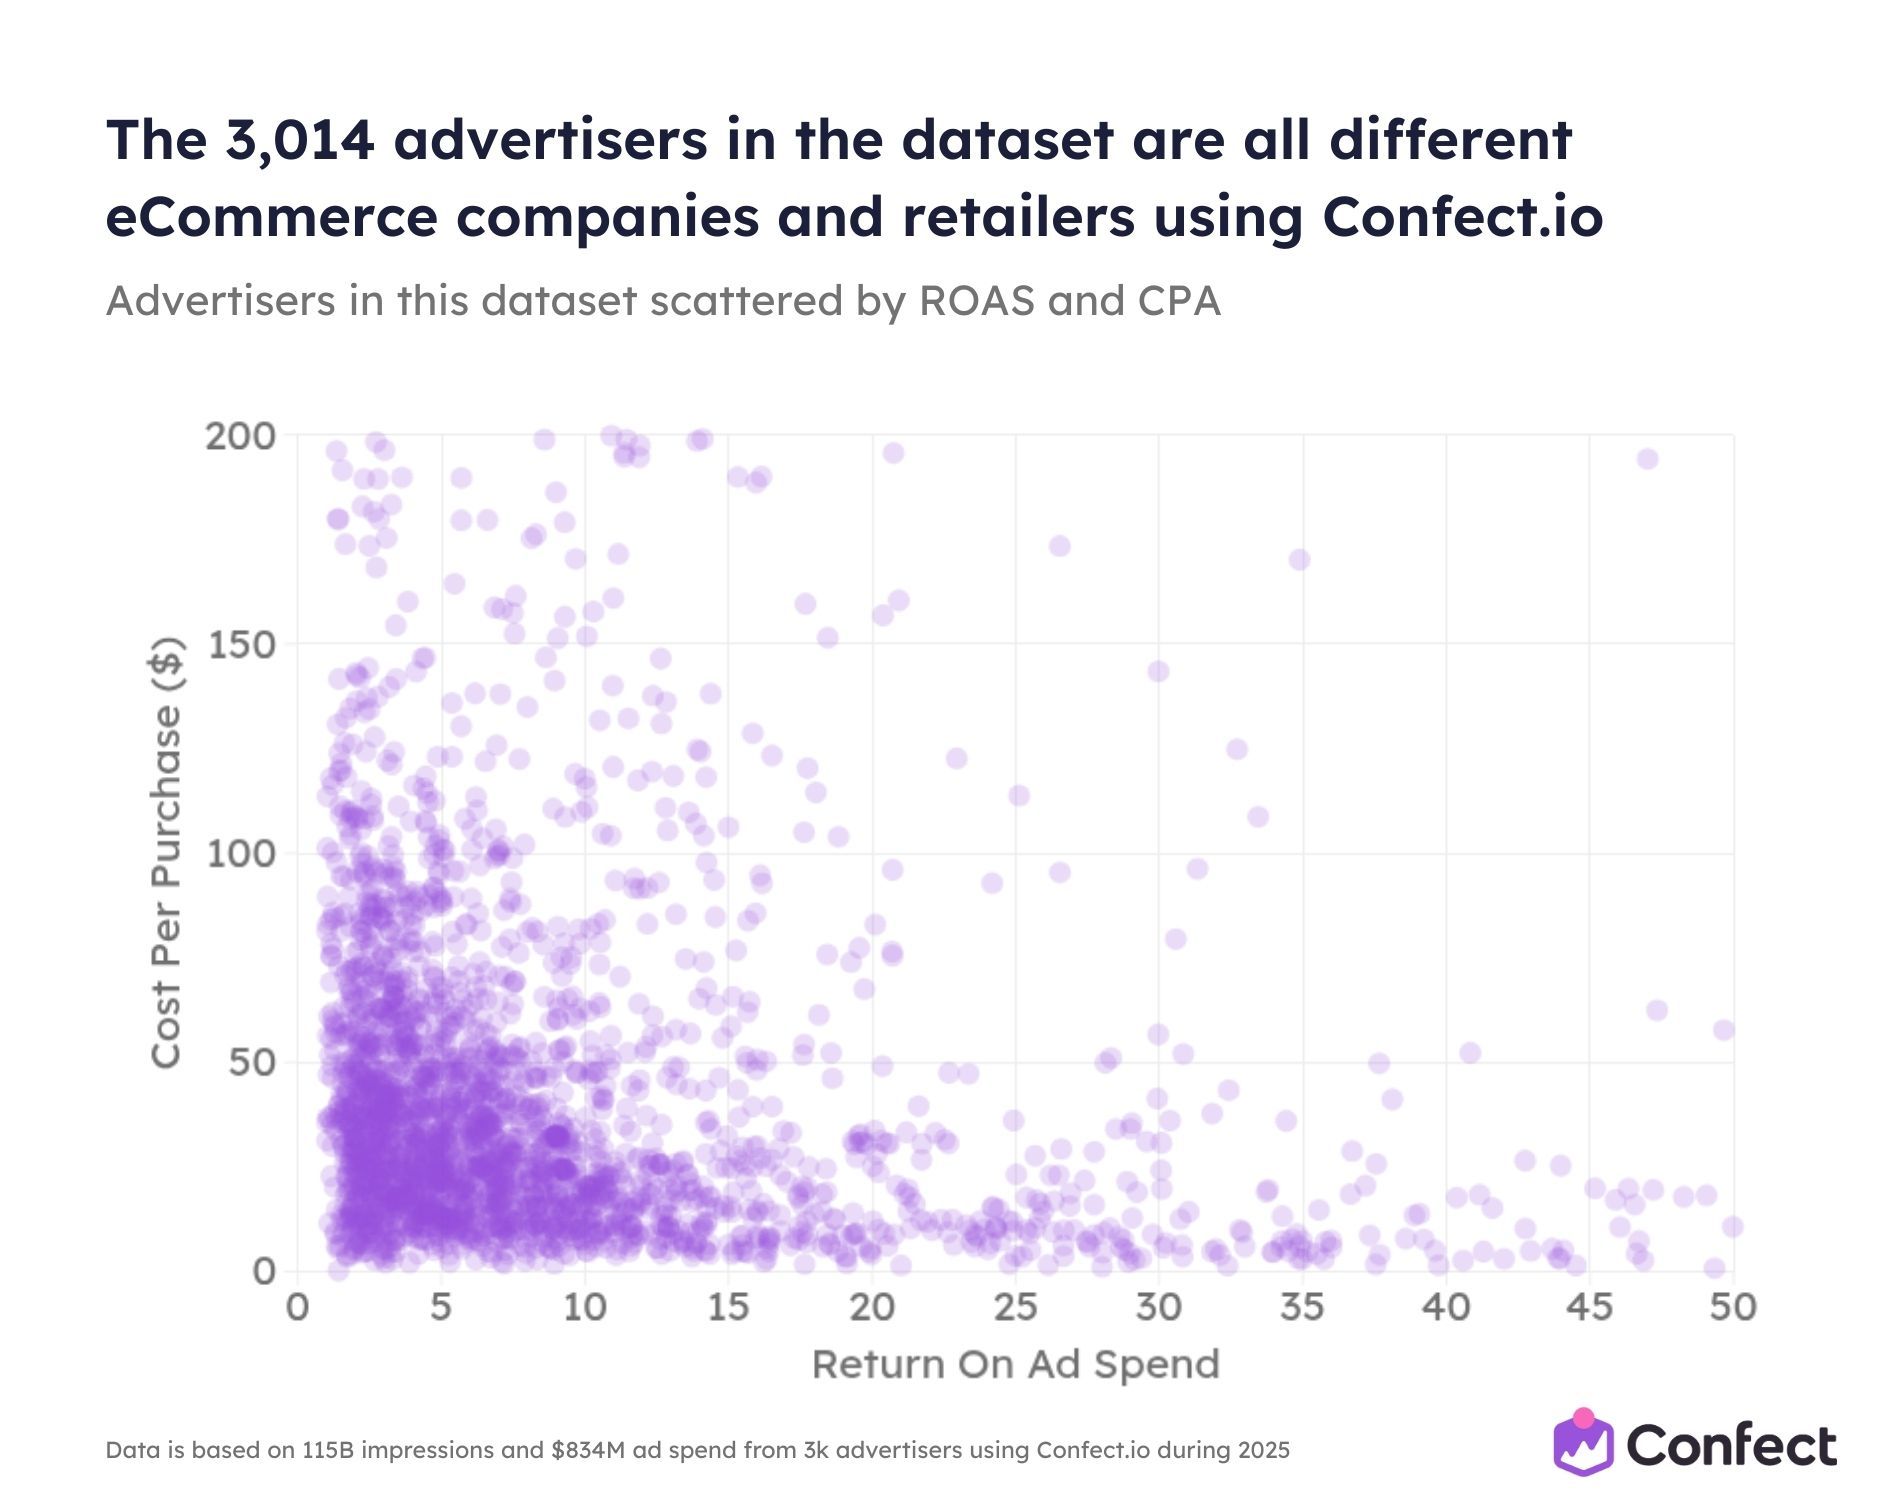
The scatter plot above shows the full spread. Performance ranges from advertisers barely breaking even at 1x ROAS and $200 CPA, all the way to outliers hitting 50x ROAS with near-zero acquisition costs.
The heaviest concentration sits between 2x and 10x ROAS with $20–$80 CPA. This is where the majority of typical eCommerce advertisers land, and where the study’s findings have the strongest statistical backing.
The wide distribution is the point. These aren’t cherry-picked success stories. The findings survived scrutiny across advertisers of wildly different sizes, industries, price points, and performance levels.
If you’re running eCommerce ads on Meta, there are businesses like yours in this dataset.
How we qualified the data
Not every data point made the cut. We applied strict qualification criteria to make sure the findings are statistically meaningful:
Qualified advertisers. We excluded 5.1% of advertisers flagged as outliers: accounts with extreme or anomalous performance that would skew the averages.
Qualified ads. We only included ads with at least 5,000 impressions to ensure each data point has a statistically significant signal. We also excluded ads with extreme performance metrics (ROAS below 0.2x or above 100x, conversion rates below 0.1% or above 20%). In total, 42.4% of ads were excluded due to these thresholds.
Qualified tags. Every segment and grouping in this study - whether by industry, advertiser size, price level, or funnel position - was only applied when we were confident the classification was correct. Ambiguous cases were excluded or marked as “other.”
The result: every chart and data point you’ll see in the following chapters is based on clean, qualified data from real eCommerce businesses running real campaigns.
How Andromeda rollout phases are defined
Throughout this ebook, you’ll see charts that track performance across four stages of the Andromeda rollout. Here’s what each stage represents:
- 0%: A 90-day period before Andromeda launched (or when only a handful of selected partner accounts had access)
- 30%: A 90-day period when 18%–42% of ad accounts were enrolled
- 70%: A 90-day period when 58%–82% of ad accounts were enrolled
- 100%: A 90-day period after October 2025, when all advertisers were on Andromeda
This phased view lets us track exactly how performance shifted as more and more accounts entered the new system - and whether the changes were temporary disruptions or permanent new baselines.
Spoiler: they’re permanent. The data shows no recovery signal at any point.
One important caveat
All advertisers in this study use Confect, which means they are all eCommerce companies running Catalog Ads. This makes the findings especially relevant for product-based businesses; but it’s worth noting when applying insights to non-eCommerce verticals.
That said, with 73 countries, six major industry verticals, and advertisers ranging from small niche brands to major multi-brand retailers, the patterns we found are remarkably consistent. What Andromeda did to eCommerce advertising, it did everywhere.
Now let’s look at what it actually did.
What Is Andromeda?
The short version: Meta rebuilt the brain of its ad system
Before December 2024, when a user opened Facebook or Instagram, Meta’s ad system used a relatively simple process to decide which ads to show. It relied on rule-based logic, audience targeting settings you defined, and historical performance data to match ads with people.
That system no longer exists.
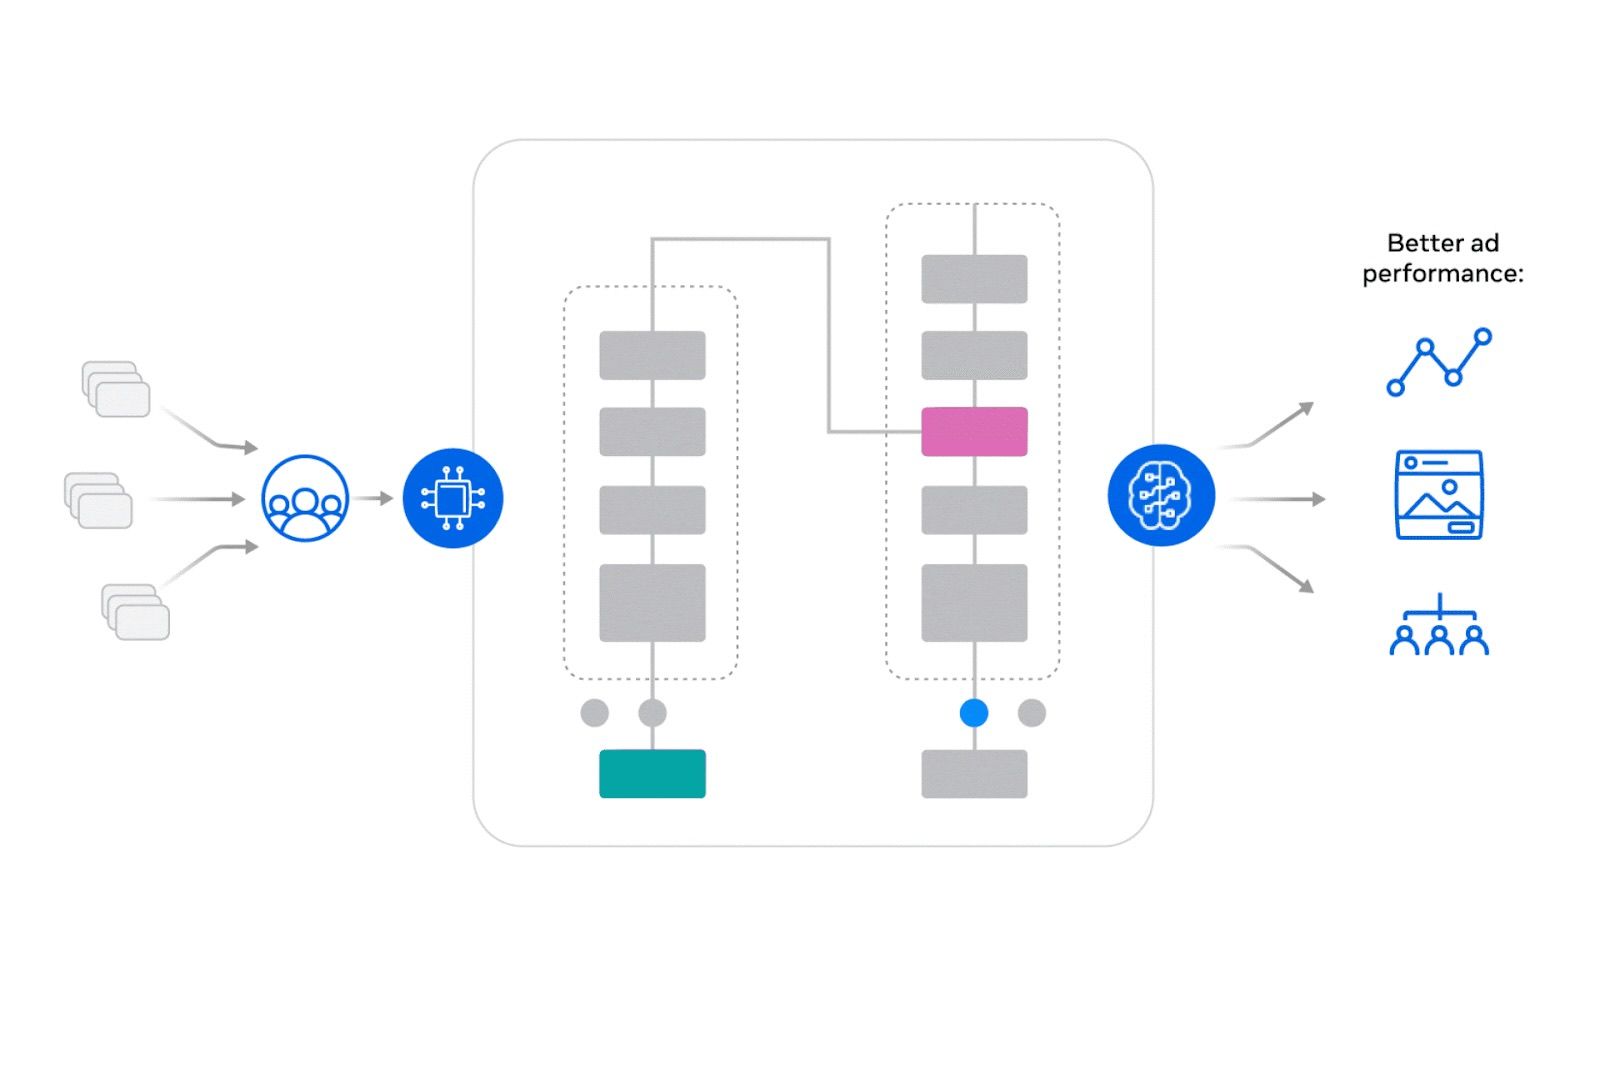
Meta replaced it with Andromeda - a completely new retrieval engine powered by deep neural networks that use computer vision and semantic analysis to read the actual content of your creatives and match them to individual users in real time.
This is not a settings change or a minor algorithm tweak. It’s a full architectural rebuild of the first and most critical stage of ad delivery: retrieval.
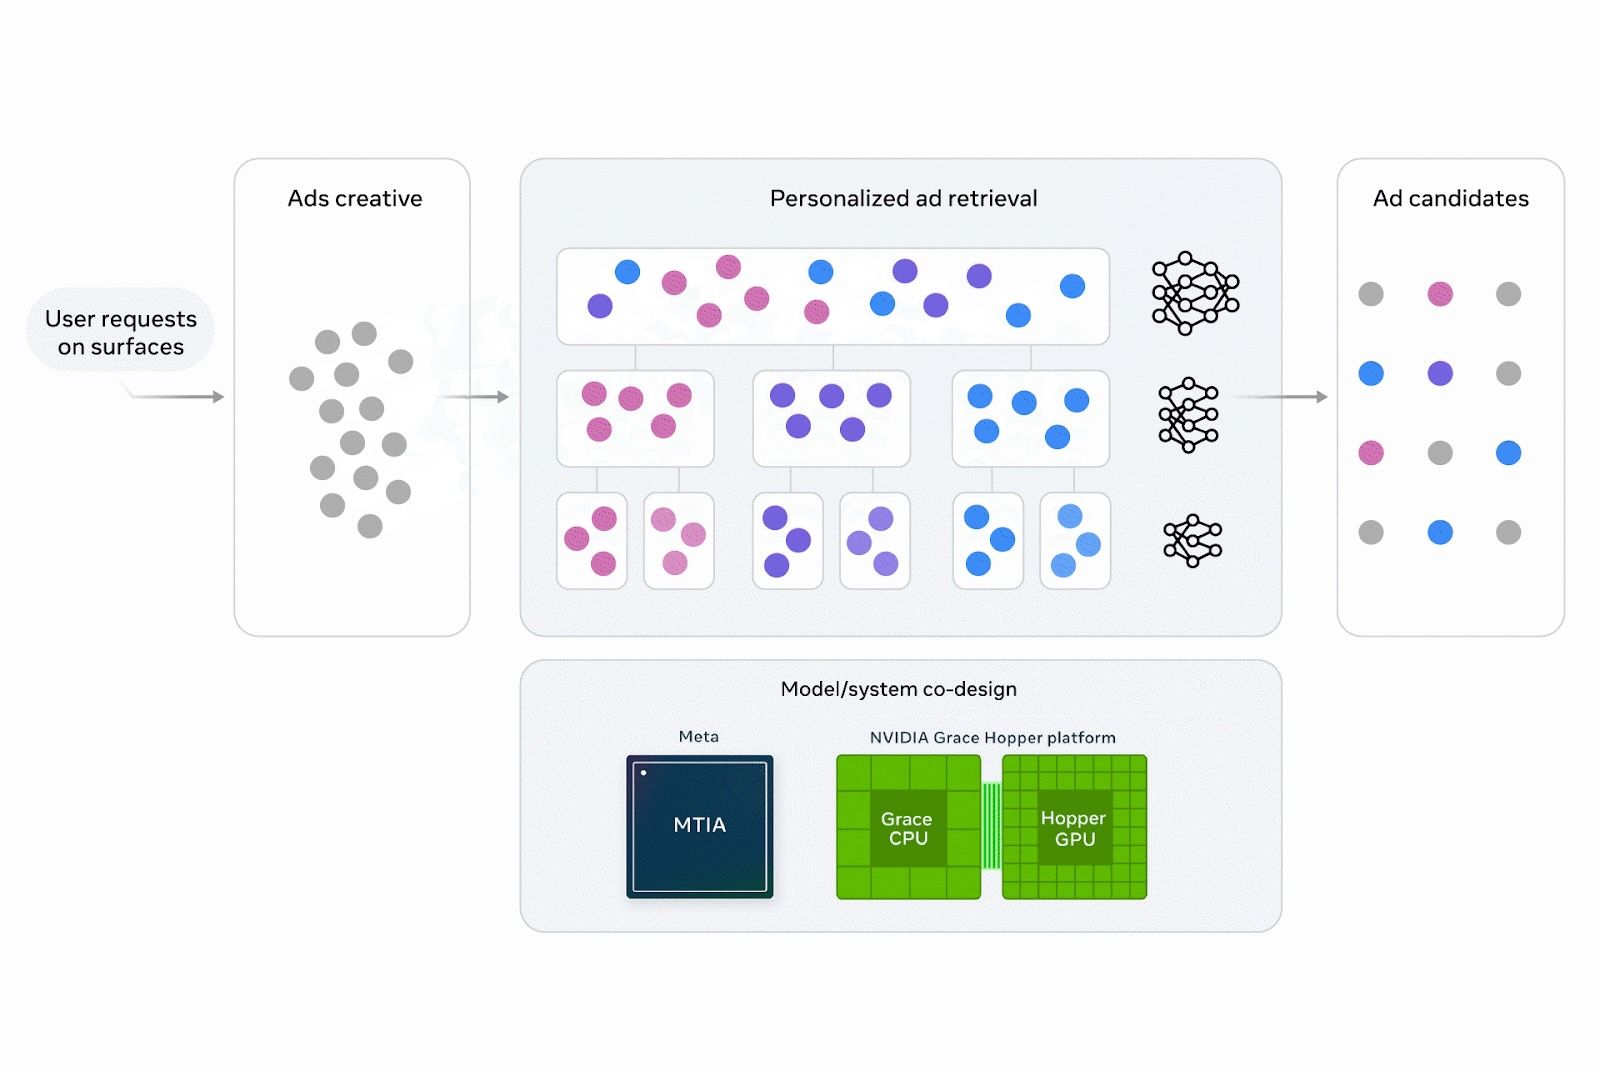
What “retrieval” means and why it matters
Meta’s ad delivery works in two stages. Most advertisers only think about the second one, the auction - where your bid, budget, and predicted performance determine whether your ad wins the impression.
But before the auction even happens, there’s a gatekeeper stage: retrieval. This is where Meta’s system scans tens of millions of active ads and narrows them down to roughly 1,000 candidates that get a ticket to compete in the auction.
If your ad doesn’t make it through retrieval, nothing else matters. Your targeting, your bid, your budget - none of it gets a chance to work.
Andromeda is that gatekeeper. And it works fundamentally differently from the old one.
The old retrieval system used rule-based heuristics and isolated model stages. It leaned heavily on the audience parameters you set; your interest targeting, your lookalike audiences, your custom audiences, to filter which ads reached which people.
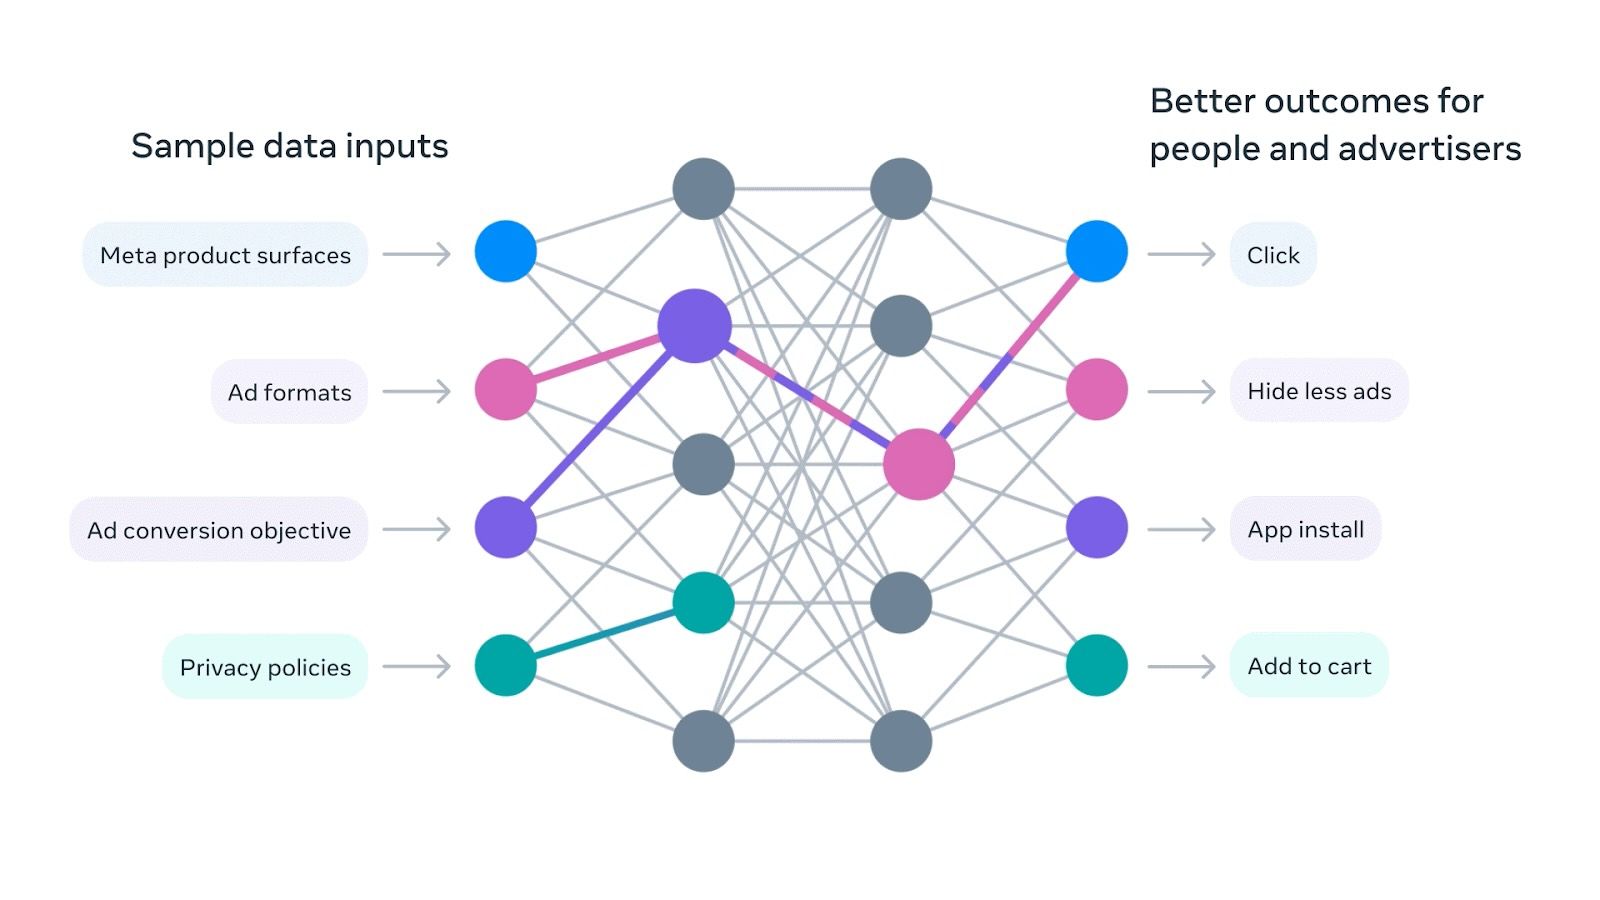
Andromeda replaces all of that with end-to-end deep neural networks. Instead of asking “does this user match the advertiser’s targeting settings?”, it asks “does this creative match this individual user’s interests and behavior?”
The primary targeting mechanism has shifted from advertiser-defined audiences to AI-driven creative matching.
In other words: your creative now does most of the targeting work.
10,000x more complex - and what that actually means for your ads
Meta’s engineering team described Andromeda as enabling a “10,000x increase in model complexity” at the retrieval stage. That sounds impressive but abstract. Here’s what it means in practice for eCommerce advertisers:
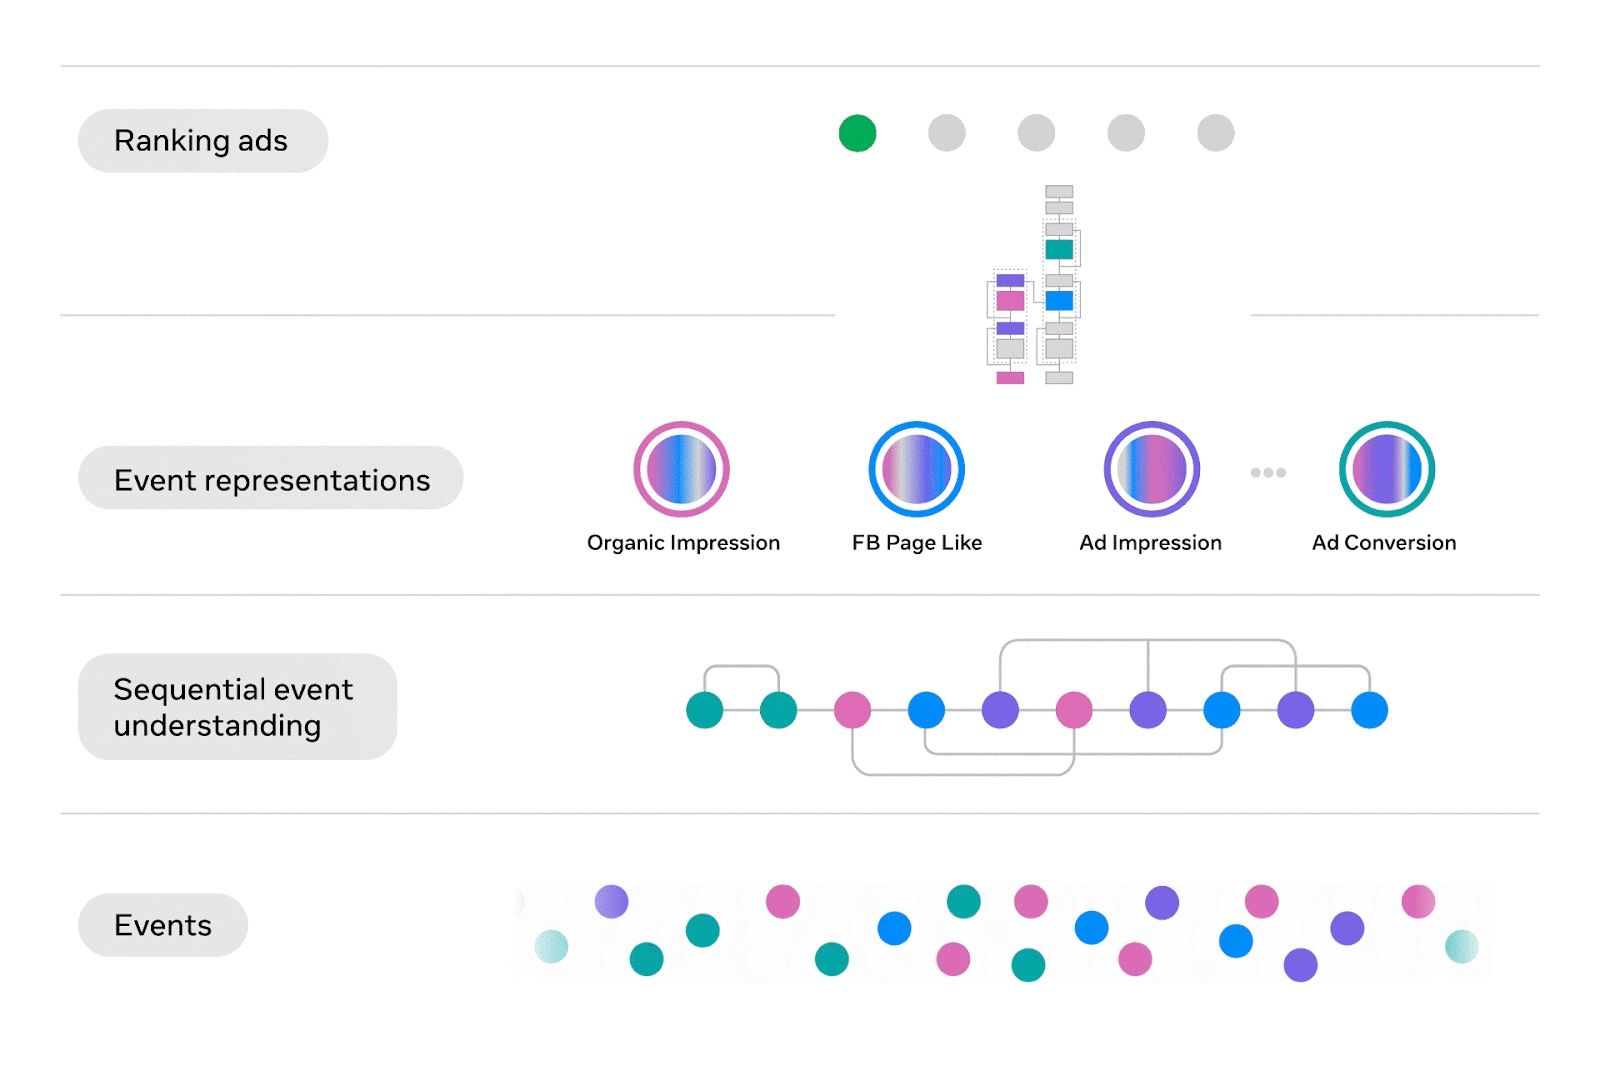
Andromeda reads your creatives. The system uses computer vision and semantic analysis to understand what’s actually in your ad: the product, the style, the text, the colors, the mood. It doesn’t just look at your targeting settings or your pixel data. It looks at the ad itself.
It clusters similar ads into one “entity.” This is one of the most important changes. If you’re running ten variations of the same product shot with minor tweaks - different headline colors, slightly cropped images, small text changes - Andromeda treats them as a single creative entity. Ten ads, one retrieval ticket.
That means the old playbook of creating dozens of small variations and letting the algorithm pick a winner is now actively working against you. The system doesn’t see 50 ads. It sees 5, or 3, or sometimes just 1.
It matches creatives to users, not audiences to ads. Andromeda builds its own understanding of who would find your creative interesting, based on real-time signals. Your interest targeting still exists, but it’s now more of a soft suggestion than a hard filter. The system will override your targeting if the creative signals suggest a better match elsewhere.
It rewards diversity and penalizes repetition. Because each genuinely distinct creative gets its own entity ID, its own ticket to the auction, advertisers with more diverse creative libraries get more chances to be matched with different user segments. Advertisers running the same concept in 20 slightly different versions get one chance.
Andromeda is not working alone
Andromeda handles retrieval, “the gatekeeper stage”. But Meta also introduced two other AI systems that work alongside it:
Meta Lattice handles the ranking stage (the auction itself). It delivered 10% metric gains and 6% conversion improvements according to Meta’s engineering team. Where Andromeda decides which ads get a chance, Lattice decides which ad wins.
GEM (Generative Engagement Model) is a generative foundation model that Meta says is 4x more efficient at driving performance. It’s the system behind Meta’s AI-powered creative tools like background generation and text variations.
Together, these three systems represent a complete overhaul. The retrieval is new. The ranking is new. The creative generation tools are new. The entire pipeline from “which ads exist” to “which ad wins the impression” has been rebuilt.
What the old playbook got wrong
If you built your Meta advertising strategy before Andromeda, chances are it was built around principles that the new system either ignores or actively penalizes.
Here’s what changed:
Narrow targeting → Broad audiences. Andromeda’s creative-first matching makes narrow interest targeting largely redundant. The system finds the right people based on creative resonance, not audience definitions. Data from Lebesgue shows broad targeting now delivers 49% higher ROAS compared to lookalike targeting under Andromeda.
Few polished creatives → Many diverse creatives. The old system rewarded finding one winning ad and scaling it. Andromeda rewards having 20–30 genuinely different creatives per ad set; mixing formats like UGC, studio shots, testimonials, product demos, and Catalog Ads. A controlled test by Five Nine Strategy showed that a single ad set with 25 diverse creatives produced 17% more conversions at 16% lower cost versus a traditional 5-ad-set structure.
Segmented campaigns → Consolidated structure. Fragmenting your spend across many narrowly targeted ad sets used to be best practice. Under Andromeda, it starves the algorithm of learning data. Fewer, broader ad sets with more creative diversity now outperform.
Pixel-only tracking → Server-side tracking. Andromeda uses conversion signal quality as a factor in retrieval. Pixel-only tracking now penalizes your ad quality score. Implementing the Conversions API with proper deduplication directly improves how often your ads make it through the retrieval gate.
Long-running winners → Fast creative rotation. Creative fatigue has accelerated dramatically under Andromeda. Effective ad lifespan has compressed from 6–8 weeks pre-Andromeda down to just 2–4 weeks, because precision matching burns through optimal audiences faster. The system finds the best users for your creative quickly - and exhausts them quickly too.
The rollout timeline
Andromeda didn’t appear overnight. Meta rolled it out in phases:
- Late 2024: Meta published the engineering details and began enrolling selected high-spending partner accounts.
- Early 2025: The rollout expanded to 18%–42% of ad accounts (our “30% phase”).
- Mid 2025: Enrollment reached 58%–82% of accounts (our “70% phase”).
- October 2025: Full global deployment completed. Every advertiser on Meta is now operating under Andromeda.
This phased rollout is actually useful for understanding impact, because it lets us compare performance across periods when different percentages of the market were on the new system.
That’s exactly what we did in this study. And the results are clear.
Why this matters more for eCommerce than any other vertical
Andromeda affects all advertisers on Meta. But eCommerce companies face a unique combination of pressures under the new system:
Your ads are product-based, which means creative diversity isn’t just about different messaging angles; it’s about different products, different formats, different visual approaches to the same catalog.
Your conversion funnel depends on post-click behavior (landing pages, product pages, checkout), and Andromeda is sending fundamentally different traffic than the old system did.
And your competitive landscape is dense. Thousands of eCommerce advertisers all competing for the same retrieval tickets, with the algorithm now deciding who gets in based on creative quality rather than budget or targeting sophistication.
The good news: the data also shows that eCommerce advertisers who adapt, particularly through Catalog Ads, have a structural advantage under Andromeda that other verticals can’t easily replicate.
But first, let’s look at the damage.
The Andromeda Impact - What the Data Shows
Andromeda has broadly suppressed performance across eCommerce advertisers on Meta. But the damage is not evenly distributed.
The following sections break down what changed - and who got hit - across ROAS, conversion rates, funnel position, advertiser size, price level, ad format, landing page type, catalog size, and ad lifecycle.
Every chart covers the same dataset: 115.7 billion impressions, $834M in ad spend, 3,014 advertisers, 73 countries, 2025.
The headline: ROAS declined 7% with no sign of recovery
Across all 3,014 advertisers, Return On Ad Spend declined by 7% during the Andromeda rollout.
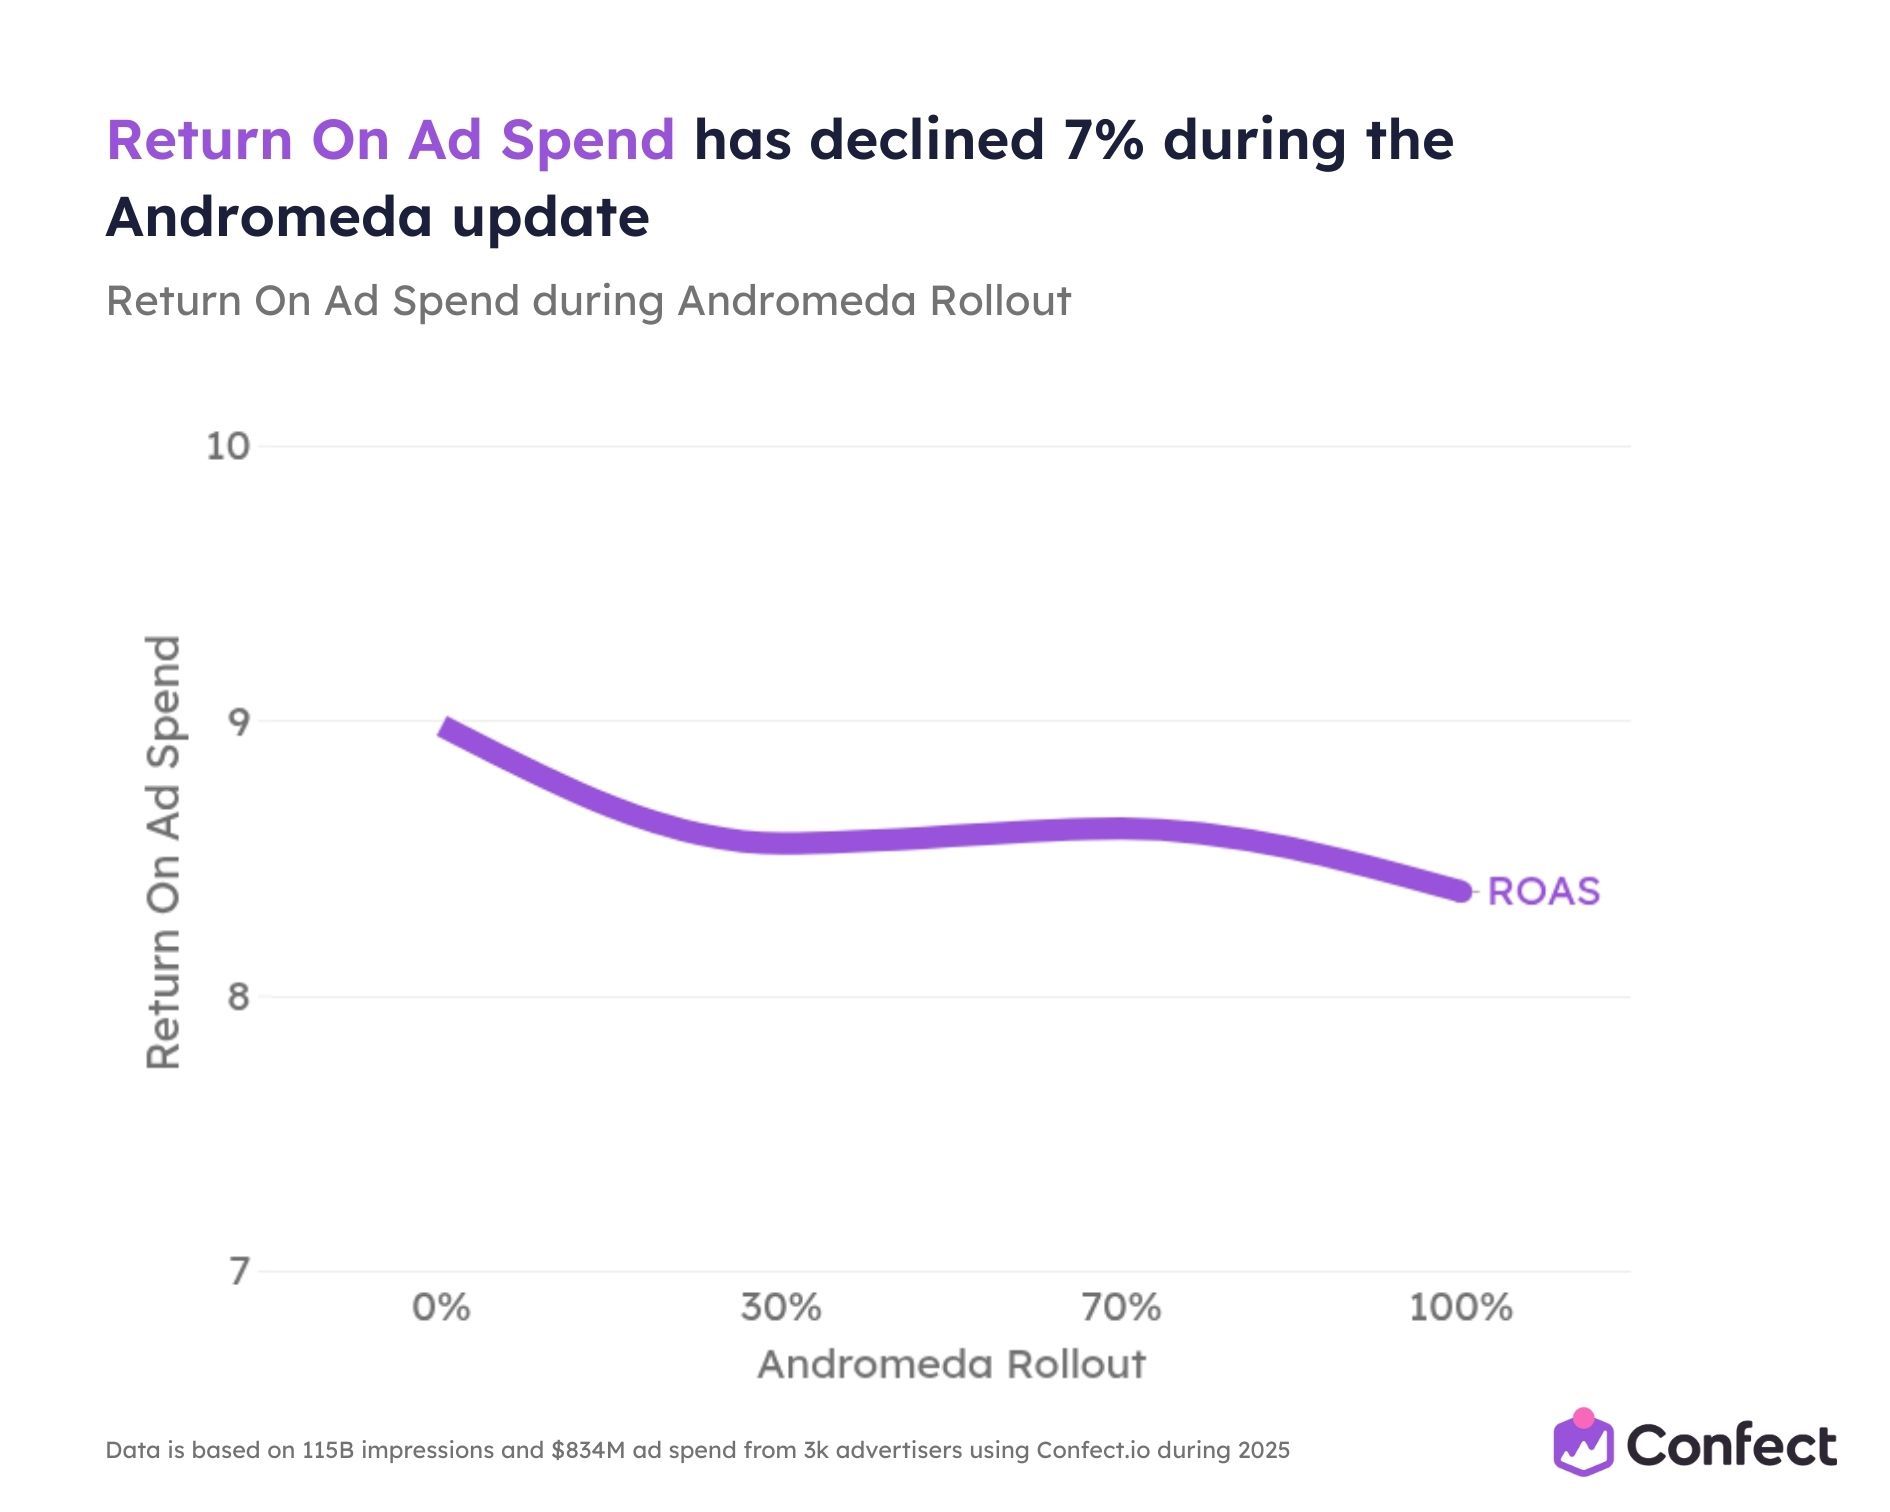
The line starts at approximately 9 ROAS at 0% rollout and drops to roughly 8.4 at full deployment. The sharpest decline happens early between 0% and 30% rollout, meaning the initial wave of adoption caused the biggest disruption. From there, it continues drifting downward through the 70% and 100% phases with no recovery signal.
This isn’t a temporary learning dip. It’s a new permanent baseline.
For an advertiser spending $100,000 per month, a 7% ROAS decline translates to roughly $7,000 in lost return - every month - that cannot be recovered by simply increasing budgets.
But 7% is a dangerous average. As we’ll see in the following sections, top performers lost 31% while bottom performers actually improved. Your reality could be far better or far worse than the headline number.
The real culprit: conversion rates dropped 17%
Here’s what makes the ROAS decline so tricky to diagnose: Andromeda is not making your ads more expensive. It’s making the visitors they deliver less likely to buy.
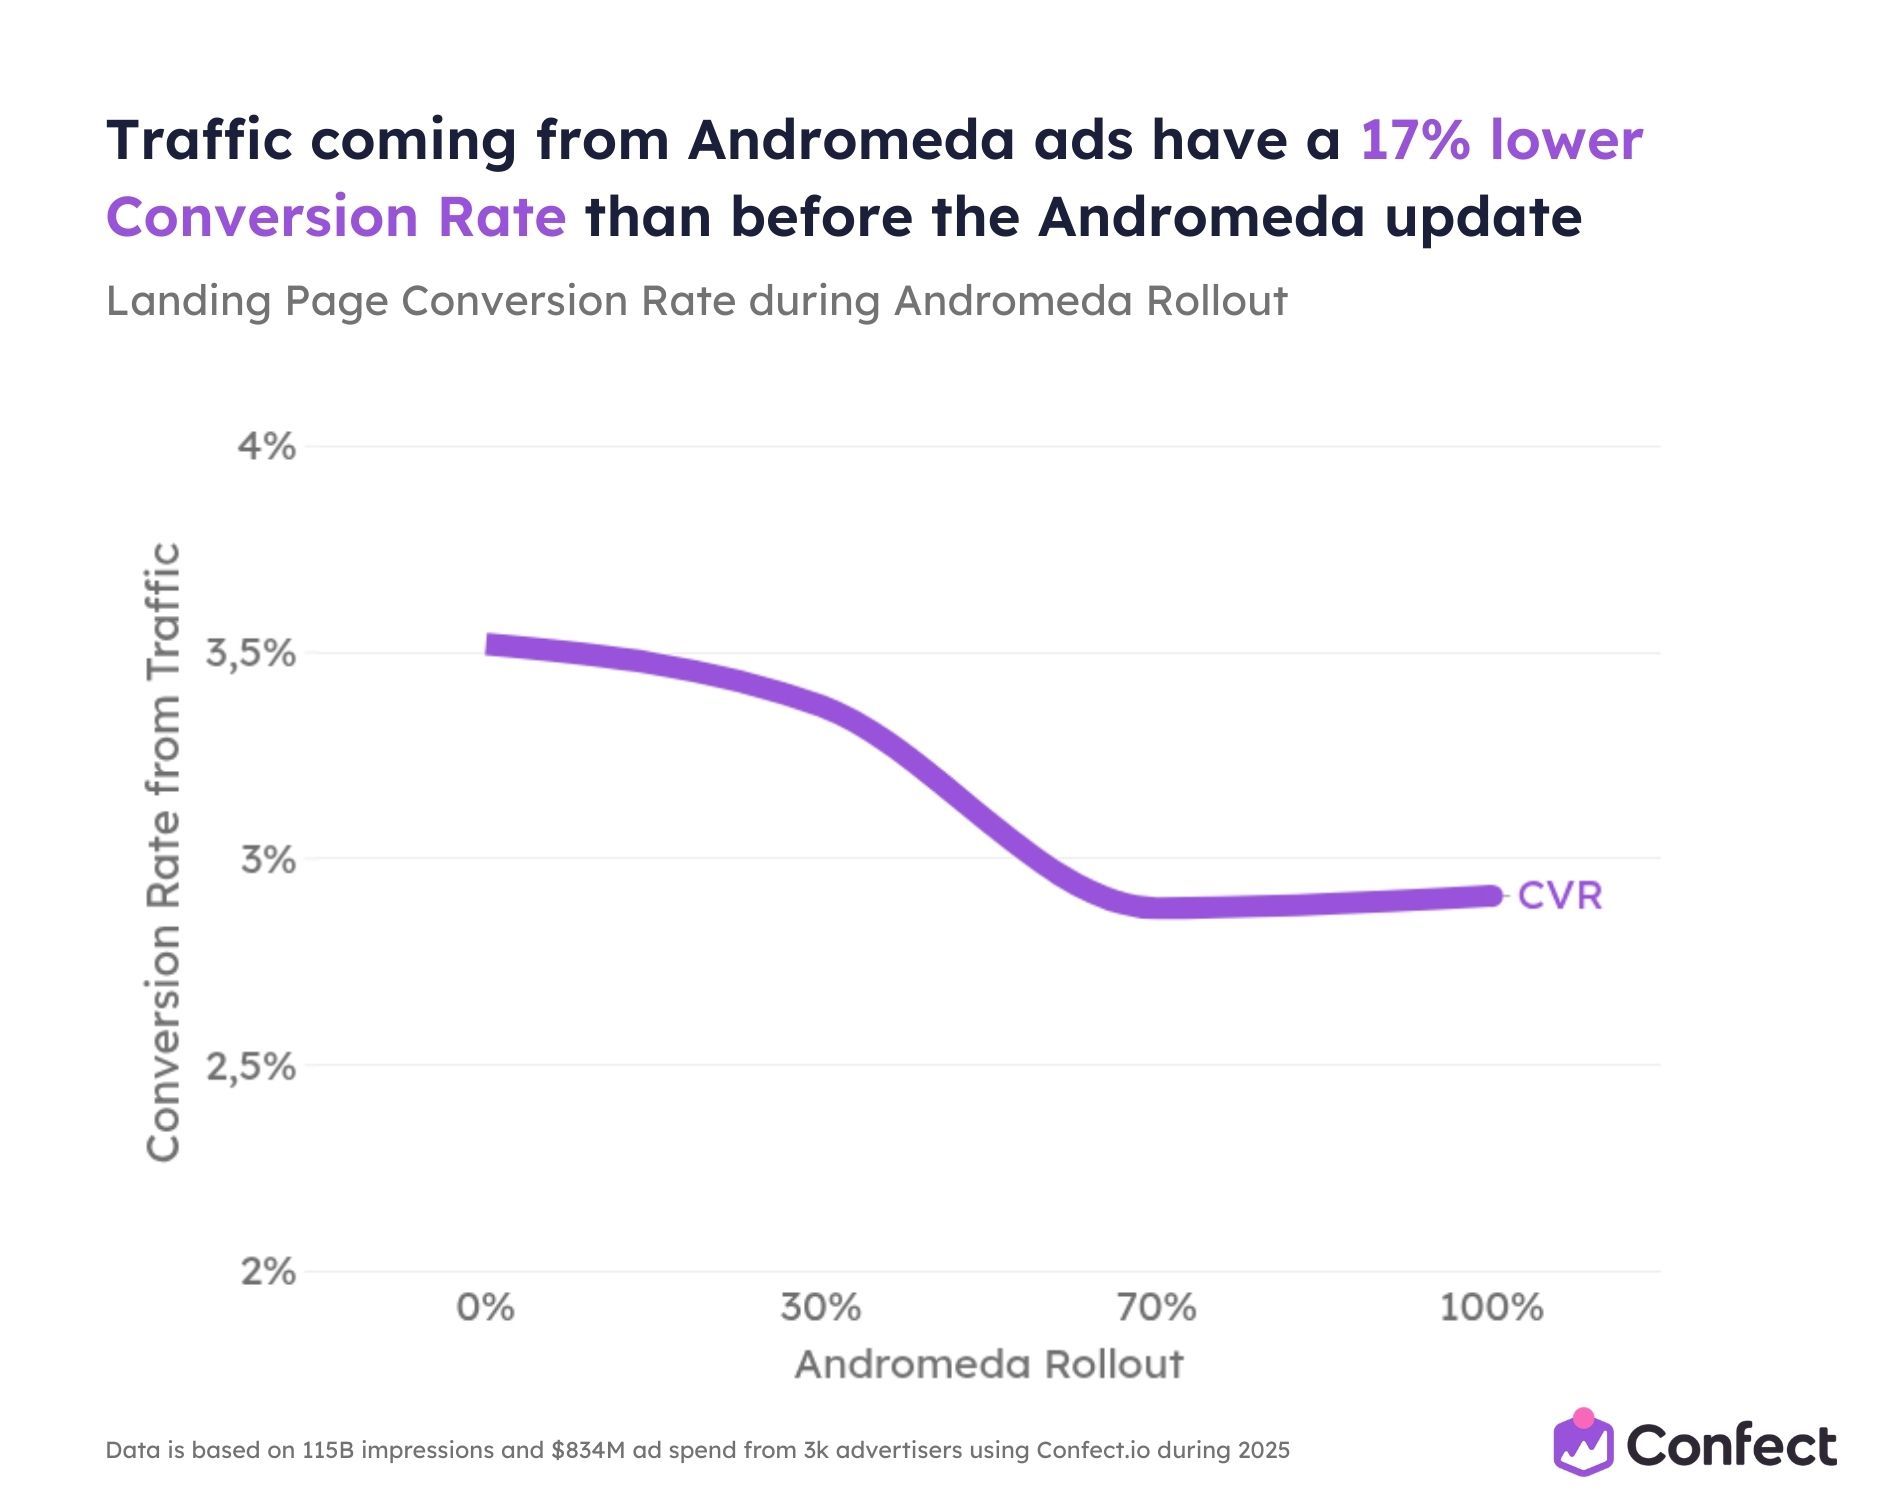
Landing page conversion rates fell by 17% across the dataset: from approximately 3.5% at 0% rollout to roughly 2.9% at full deployment.
This reframes the entire problem. The fix doesn’t live inside Meta Business Manager. It lives on your website and landing pages.
Why is this happening? Andromeda uses computer vision and semantic analysis to match creatives to users based on content relevance, not purchase history. It’s reaching people who find your ad interesting, but who may not be actively shopping. The old system leaned heavily on pixel data and past purchase behavior to find high-intent converters. Andromeda deprioritizes those historical signals in favor of real-time creative resonance.
The result: broader reach, colder traffic, lower conversion rates.
For every 1,000 visitors your ads deliver, roughly 5 fewer are completing a purchase compared to pre-Andromeda. That compounds into significant revenue gaps at scale over weeks and months.
The steepest conversion rate decline happens mid-rollout (between 30% and 70%), suggesting that traffic quality degradation lagged behind the initial cost impacts shown in the ROAS chart. By full rollout, the line flattens at approximately 2.9%, establishing a new baseline that advertisers need to plan around.
The funnel split: prospecting took a 13% hit
Andromeda is disproportionately punishing prospecting campaigns.
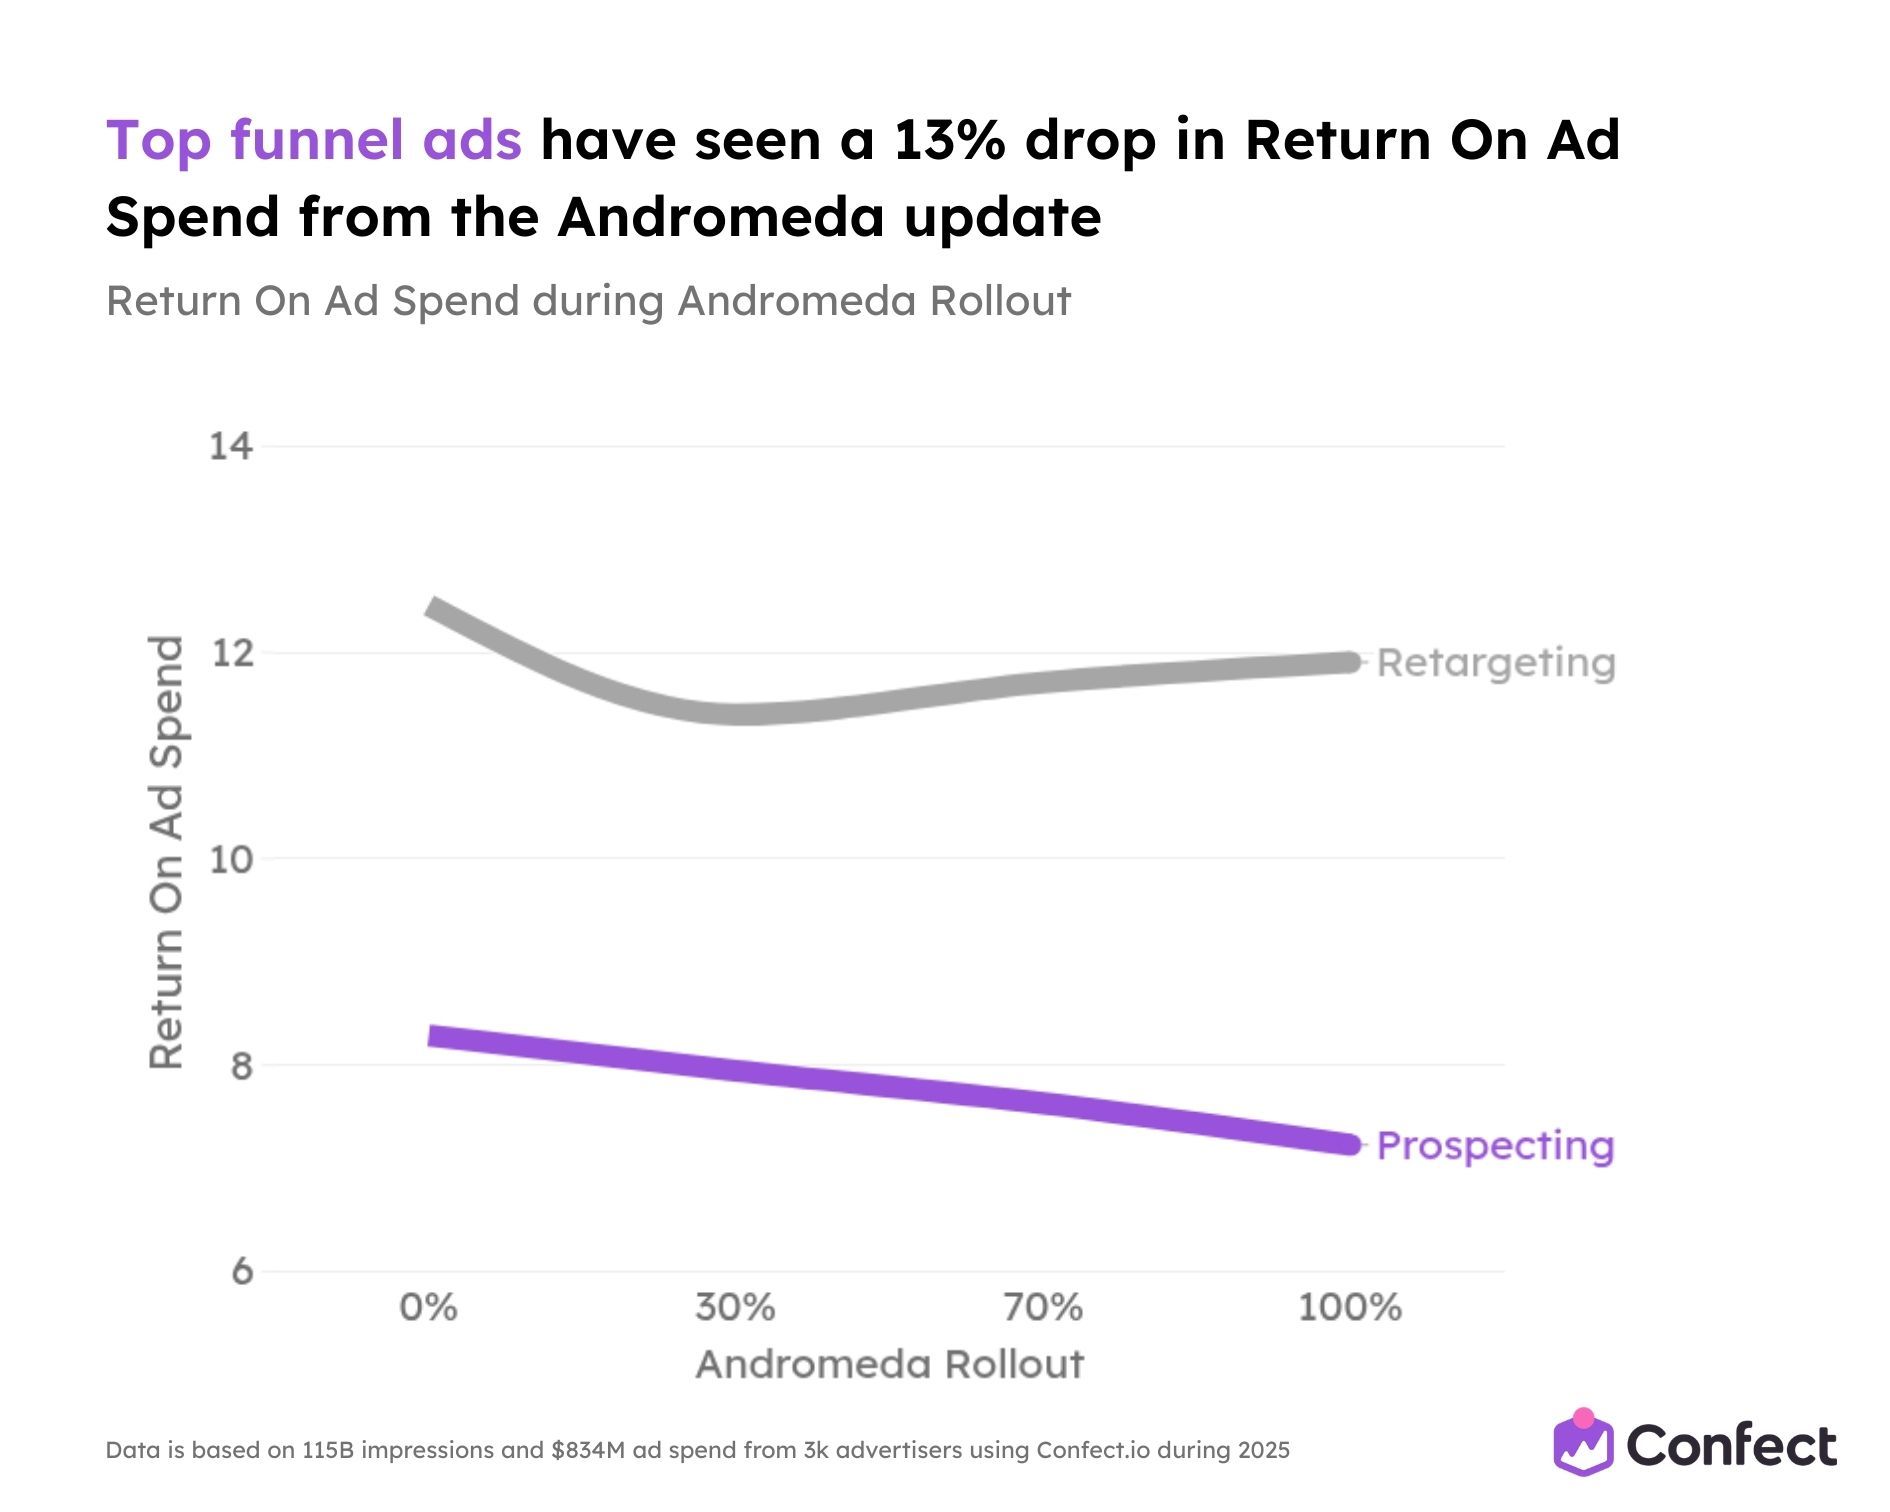
Top-of-funnel prospecting ads saw a 13% ROAS decline, while retargeting remained relatively stable with only a modest dip.
This makes strategic sense. Prospecting campaigns target cold audiences by definition, and Andromeda’s broadened reach means these campaigns now serve even colder users than before. Retargeting campaigns, on the other hand, benefit from a built-in advantage: dynamic product ads show users the exact items they already viewed, giving Andromeda a strong relevance signal that prospecting creatives have to work much harder to replicate.
The gap between retargeting and prospecting ROAS has actually narrowed during the rollout - from about 4.2 points pre-Andromeda to about 4.2 points at full rollout - suggesting Andromeda is blurring traditional funnel boundaries as it increasingly decides on its own who sees what.
The implication for growth strategy is direct: if prospecting gets more expensive and less efficient, the pipeline of new customers feeding your retargeting audiences will shrink over time. Advertisers who gut their prospecting budget to prop up short-term retargeting ROAS will eventually hit a ceiling as their warm audience pools deplete without top-of-funnel replenishment.
The great equalizer: top performers lost 31%
This is the most alarming finding in the entire study.
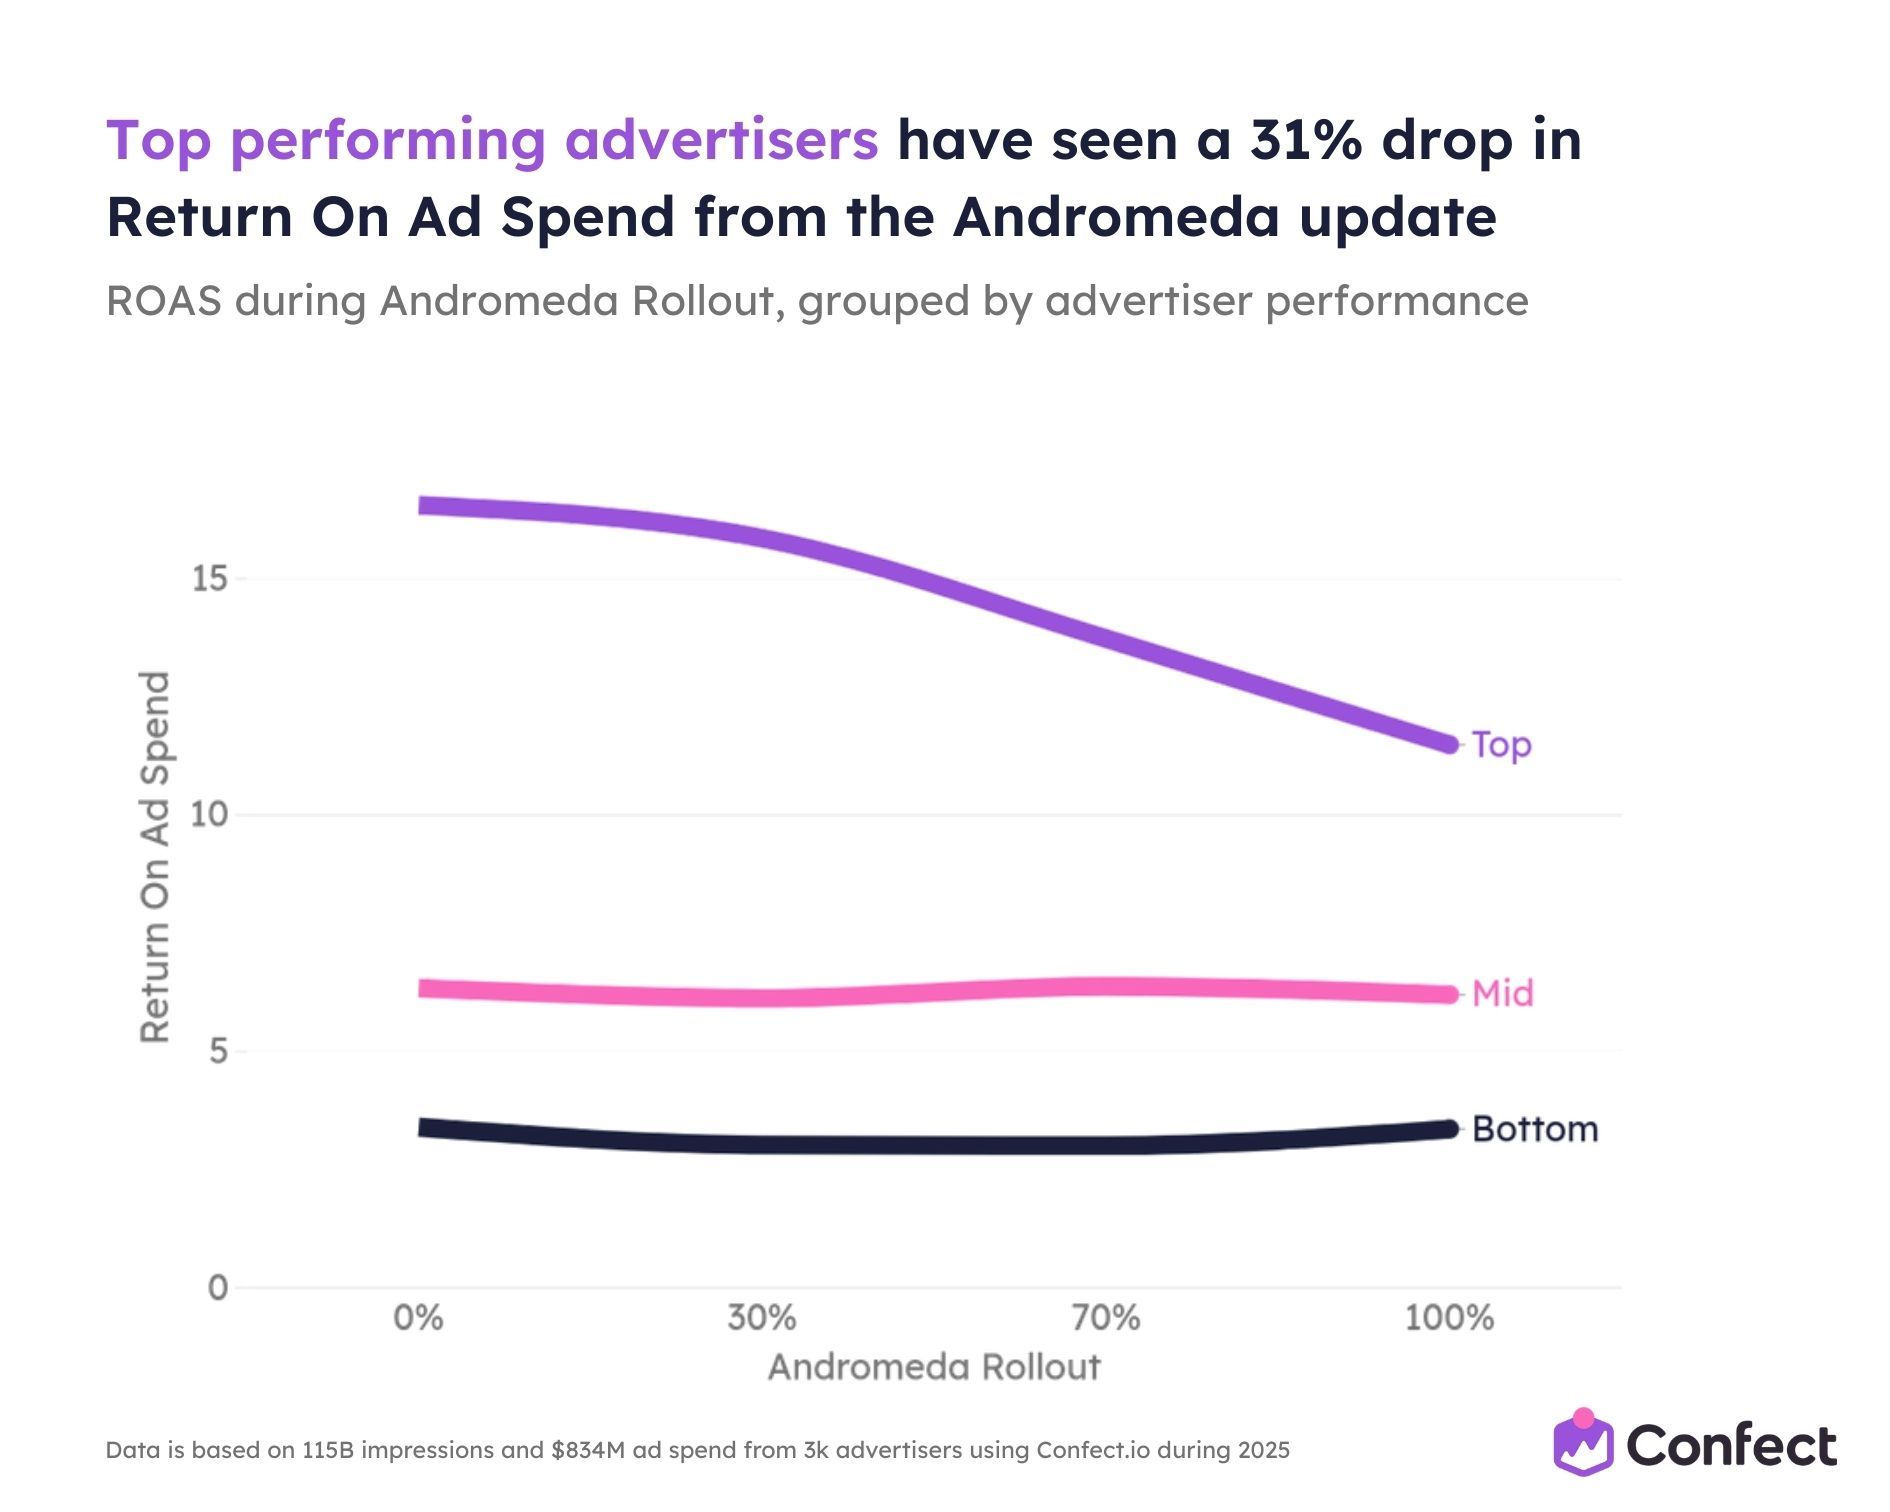
The advertisers who were winning the most before Andromeda have been punished the hardest. Top performers, the top third of advertisers by ROAS within their industry, saw a 31% collapse in Return On Ad Spend, dropping from approximately 17 to roughly 11.0.
Mid performers barely moved. Bottom performers actually trended slightly upward.
Andromeda has acted as a great equalizer, compressing the performance gap between elite advertisers and everyone else.
Why? Because top performers were typically running hyper-optimized campaigns with a small number of proven creatives and precise audience targeting. That’s the exact opposite of what Andromeda’s creative-first retrieval engine rewards. These accounts relied on deep historical performance data that the old algorithm used to find high-intent converters. Andromeda deprioritizes those signals.
Worse: Andromeda’s entity clustering treats all minor creative variations as a single ad. A top performer running 15 polished variations of one winning concept effectively has one retrieval ticket. A bottom performer with 5 rough but genuinely different concepts has five.
The old playbook that built your competitive advantage is now your biggest liability.
Size matters, but differently now
The traditional assumption that bigger budgets buy better results on Meta has been flipped.
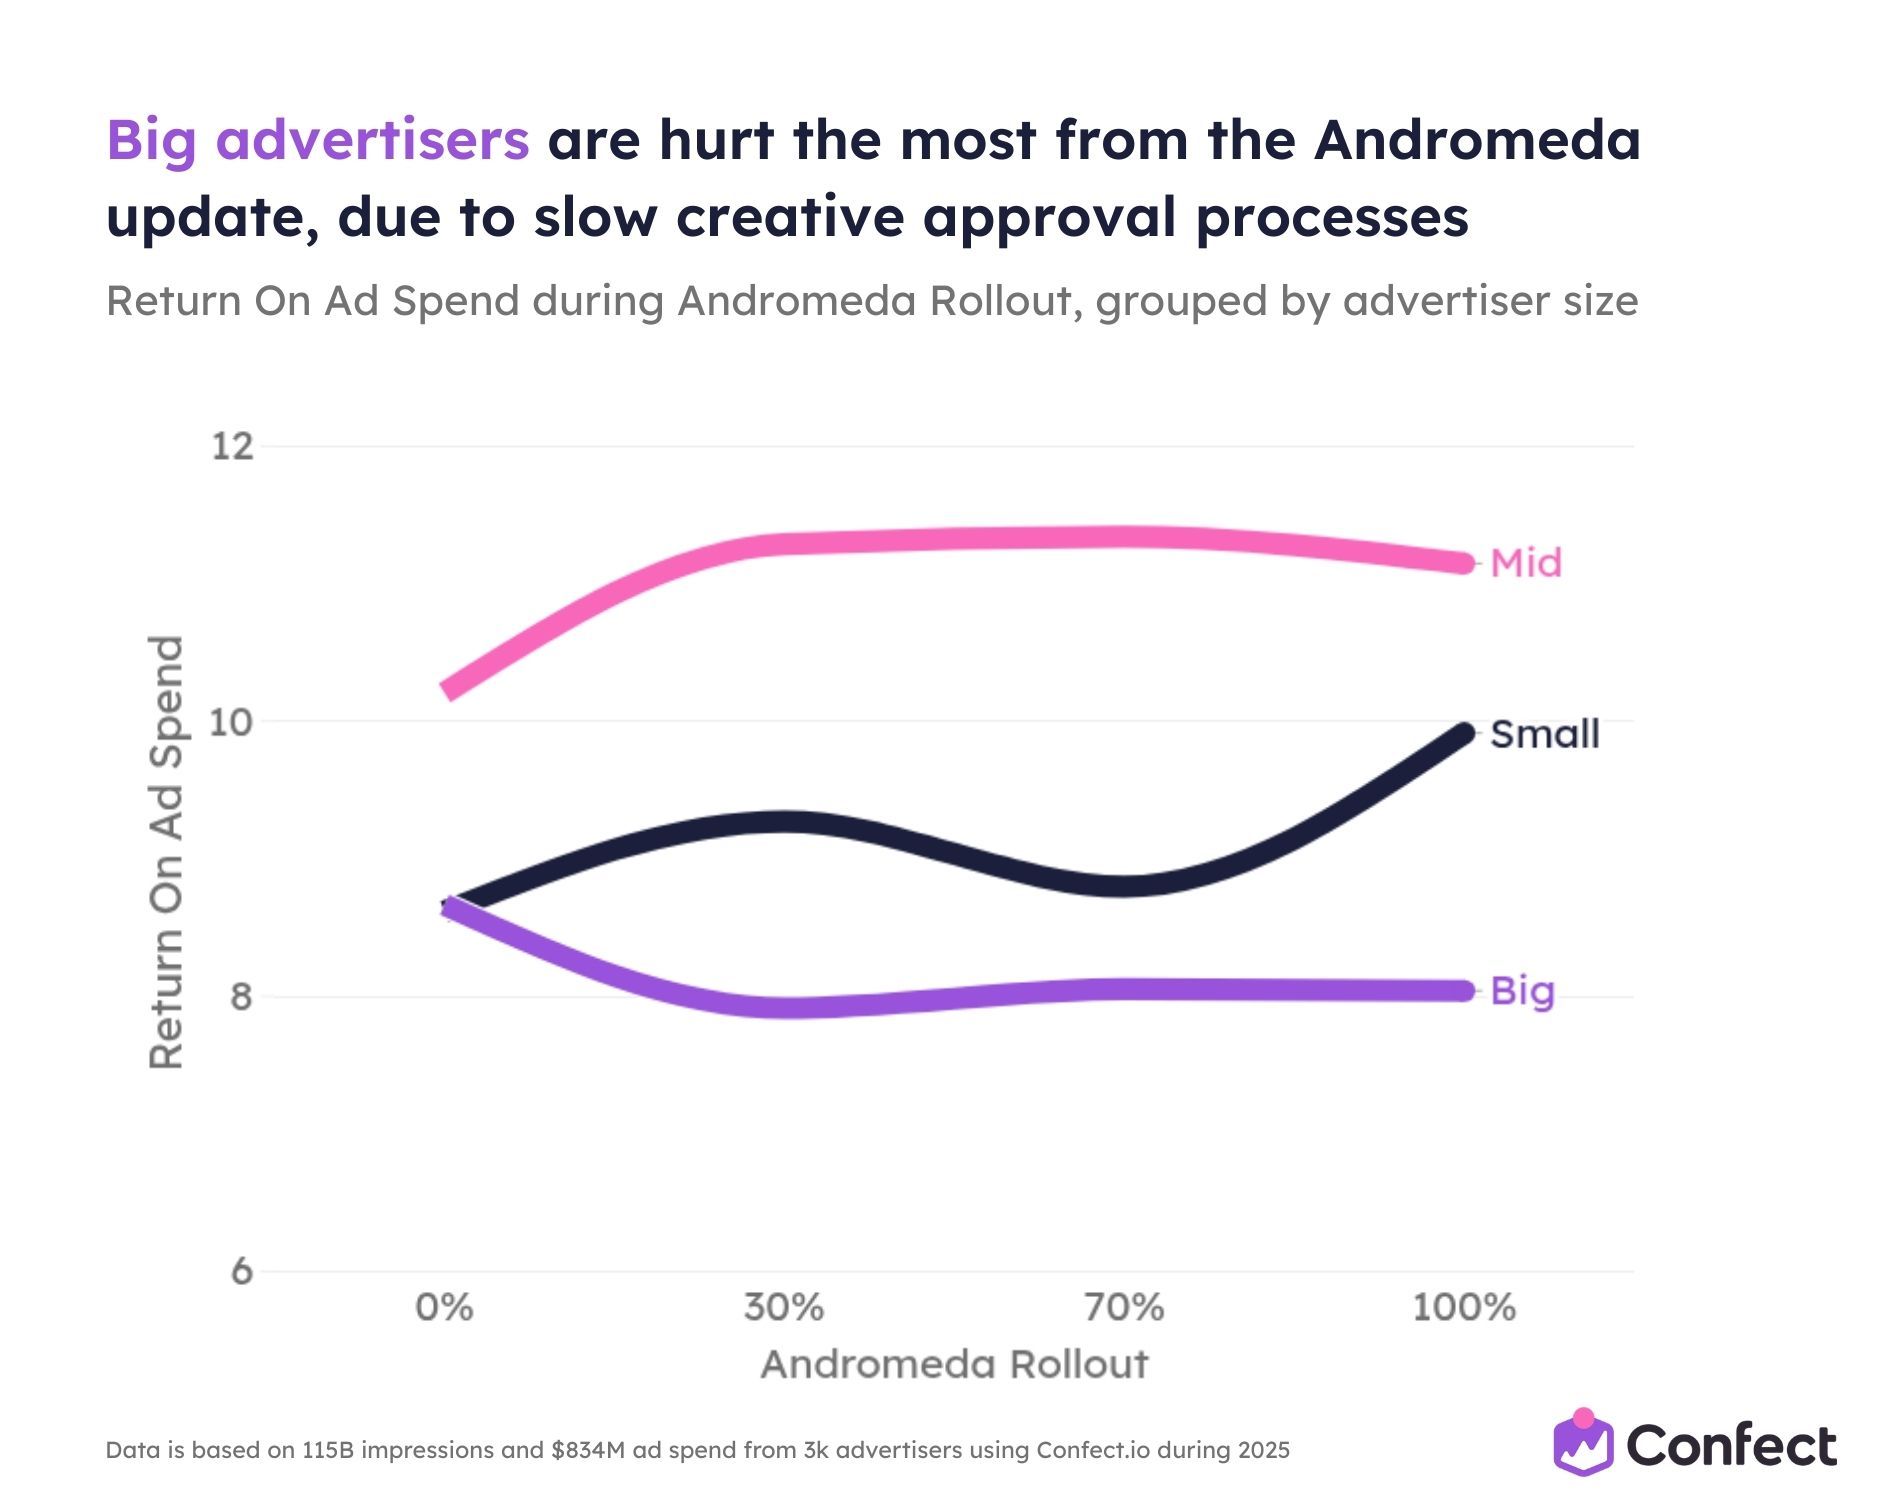
Mid-sized advertisers (spending $34,400–$172,400 per year on Conversion campaigns) are the clear winners. They’re the only size segment that actually improved ROAS during the Andromeda rollout, climbing from approximately 10.5 to roughly 11.0.
Big advertisers (spending over $172,400/year) declined consistently from approximately 8.7 to around 8.0.
Small advertisers (under $34,400/year) showed the most volatile trajectory - rising, dipping, then recovering - but ended up in a reasonably good position at approximately 10.0.
The reason the PDF slide itself names: slow creative approval processes. Big advertisers tend to run fewer, more polished creatives for longer periods. They have multi-layer approval chains, brand compliance reviews, and agency coordination that simply can’t keep pace with Andromeda’s demand for constant creative diversity.
Mid-sized advertisers hit the sweet spot. They have enough budget to generate meaningful conversion volume for Andromeda’s learning, but are still lean enough to iterate quickly on creative.
This is an organizational problem disguised as a platform problem. No amount of media buying optimization will fix it if internal workflows can’t produce and approve new creatives fast enough.
The pricing sweet spot: mid-priced products win
Andromeda has reshuffled which price tiers perform best on Meta and the result is a complete inversion of the pre-Andromeda hierarchy.

Mid-priced shops are the only price segment that improved ROAS during the rollout, climbing from approximately 8 to roughly 9.5. They went from worst to best.
High-end advertisers experienced a steep fall, dropping from a dominant ROAS of approximately 12 down to around 10 - a 17% loss.
Affordable shops suffered the most dramatic reversal of all. They went from nearly 10 ROAS pre-Andromeda to roughly 6.5 at full rollout. A catastrophic 35% decline. From second-best to worst.
The three lines converge and cross near the 70% rollout mark, creating a visible inversion where the entire pre-Andromeda pricing hierarchy reshuffles.
Why? Mid-priced products occupy a conversion sweet spot. The purchase decision is neither so cheap that it attracts low-quality impulse clicks, nor so expensive that it requires multiple touchpoints beyond what a single ad can deliver. Andromeda’s broader, colder traffic has lower purchase intent. High-end products suffer because luxury purchases require trust and familiarity that cold audiences don’t have yet. Affordable shops get hurt by CPM compression; as Andromeda expands delivery to broader audiences, the cost to reach users stays similar, but low average order values can’t absorb rising acquisition costs.
The new ad lifecycle: peak in week one, plateau after
Andromeda has fundamentally changed how ads perform over time.
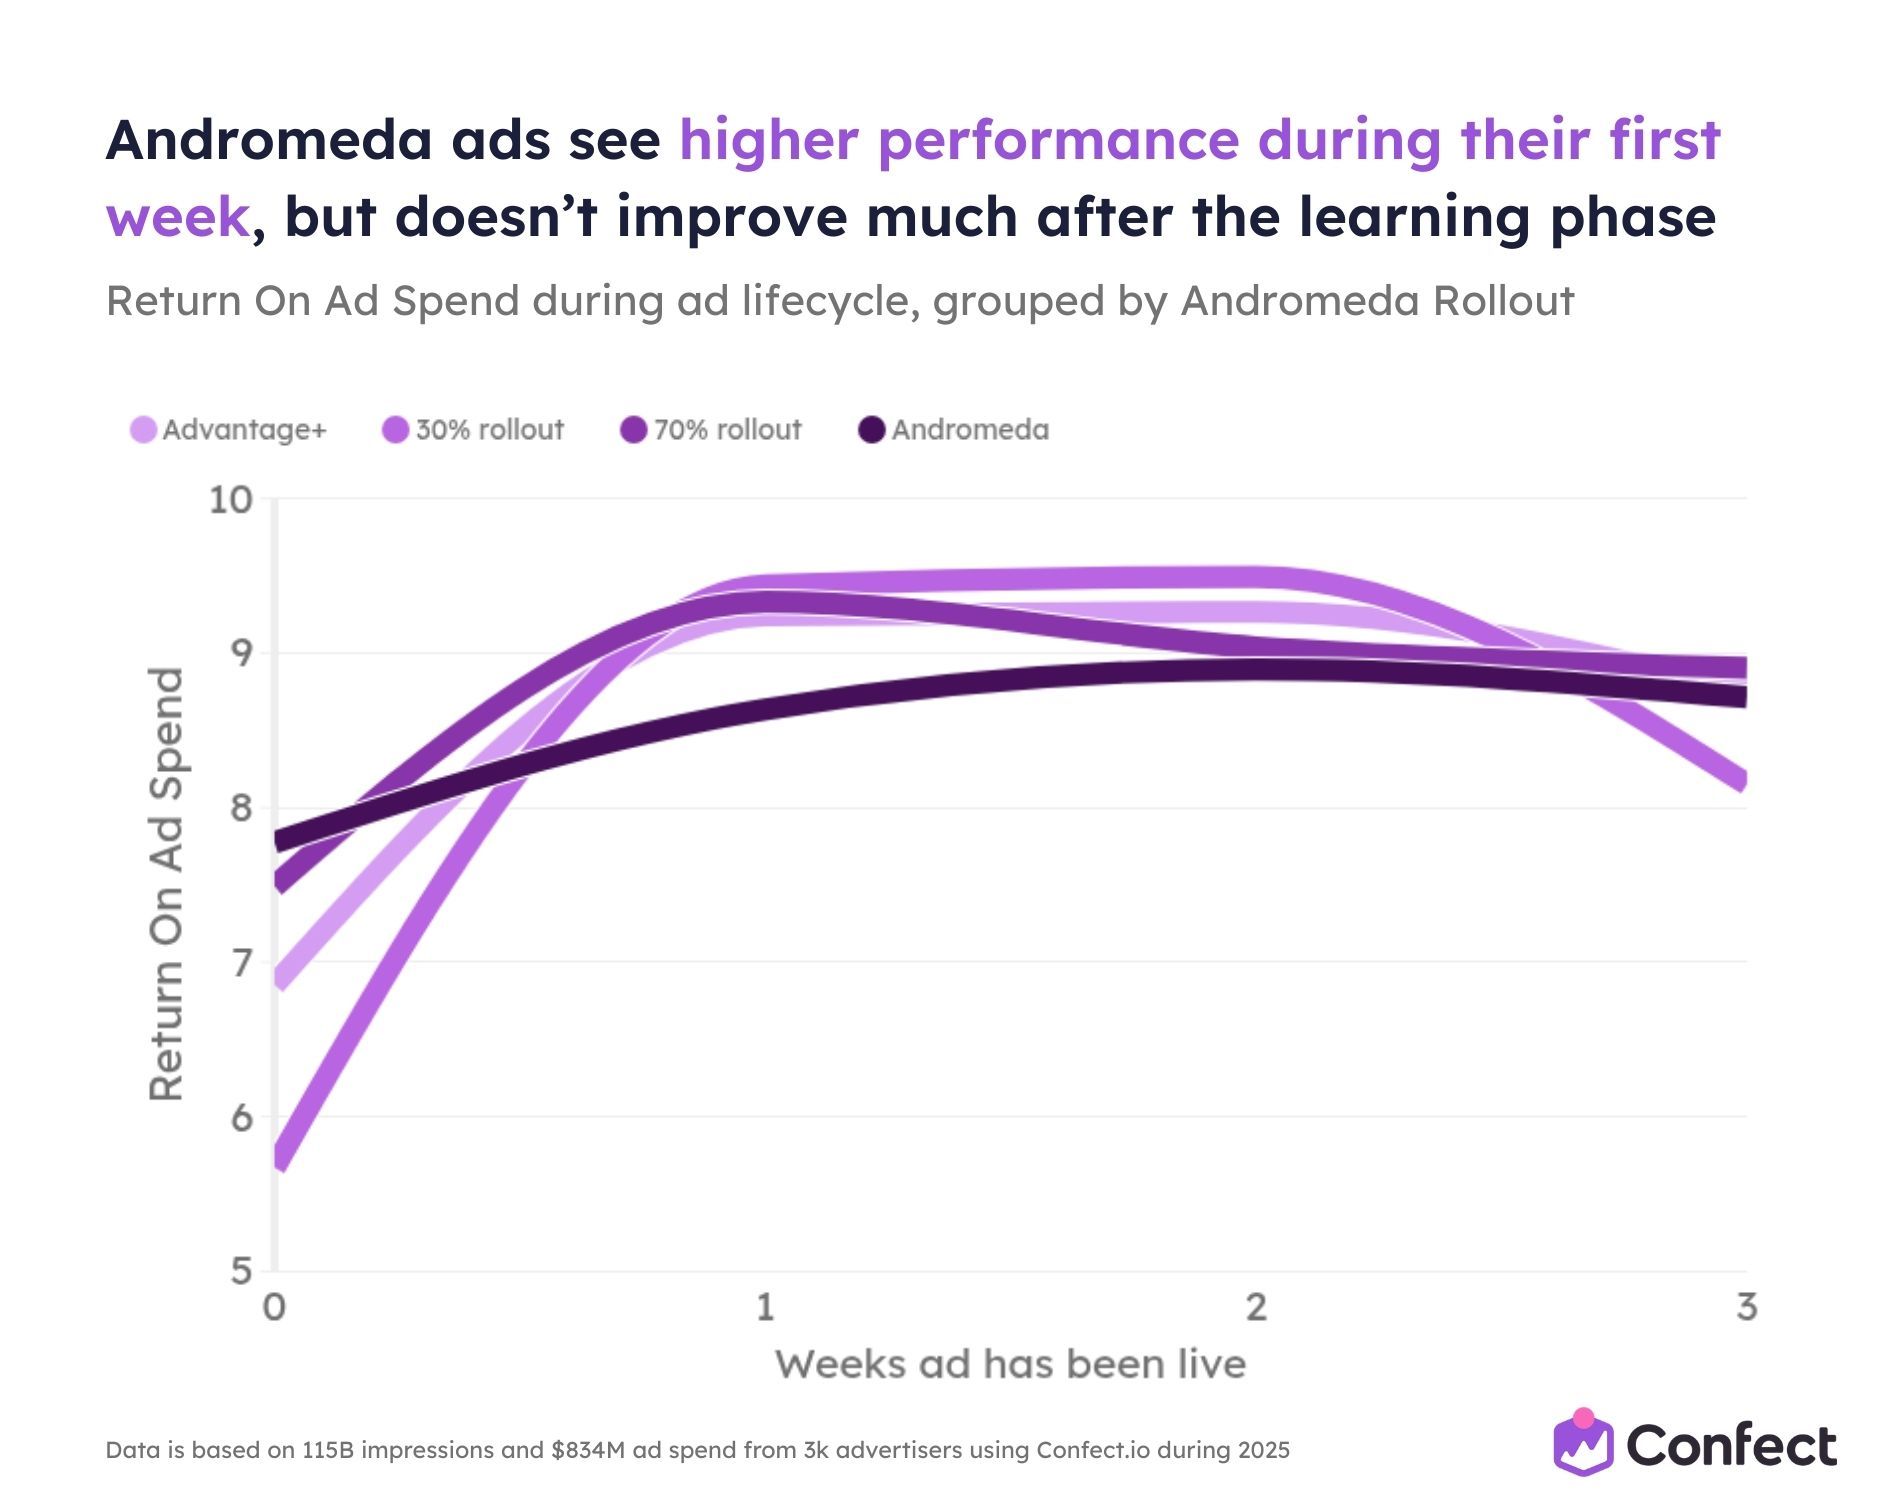
Under the old system, ads would ramp up over 2–3 weeks as the algorithm gradually learned who to show them to. Under Andromeda, ads reach peak performance in their first week and then plateau. The traditional belief that patience and “learning phases” lead to progressively better results is no longer supported by the data.
The full Andromeda line starts at approximately 7.8 ROAS in week zero, climbs to around 8.8 by week one, and then flatlines - showing no meaningful improvement through weeks 2 and 3. By week 3, all rollout-stage lines converge between 8.2 and 8.8, regardless of when the ad launched.
This happens because Andromeda’s retrieval engine is extraordinarily efficient at finding the best-fit users for a given creative immediately. It creates a strong initial performance burst, but also depletes the optimal audience faster. Once the system has determined what kind of user responds to a creative, it quickly saturates that segment and has nowhere else to go with the same concept.
The implication: if your ad hasn’t performed by week one, it’s unlikely to improve. Replace it with something genuinely different.
The landing page inversion: category pages collapsed 24%
This is one of the most immediately actionable findings in the entire study, because changing a landing page URL requires zero creative production and can be done in minutes.
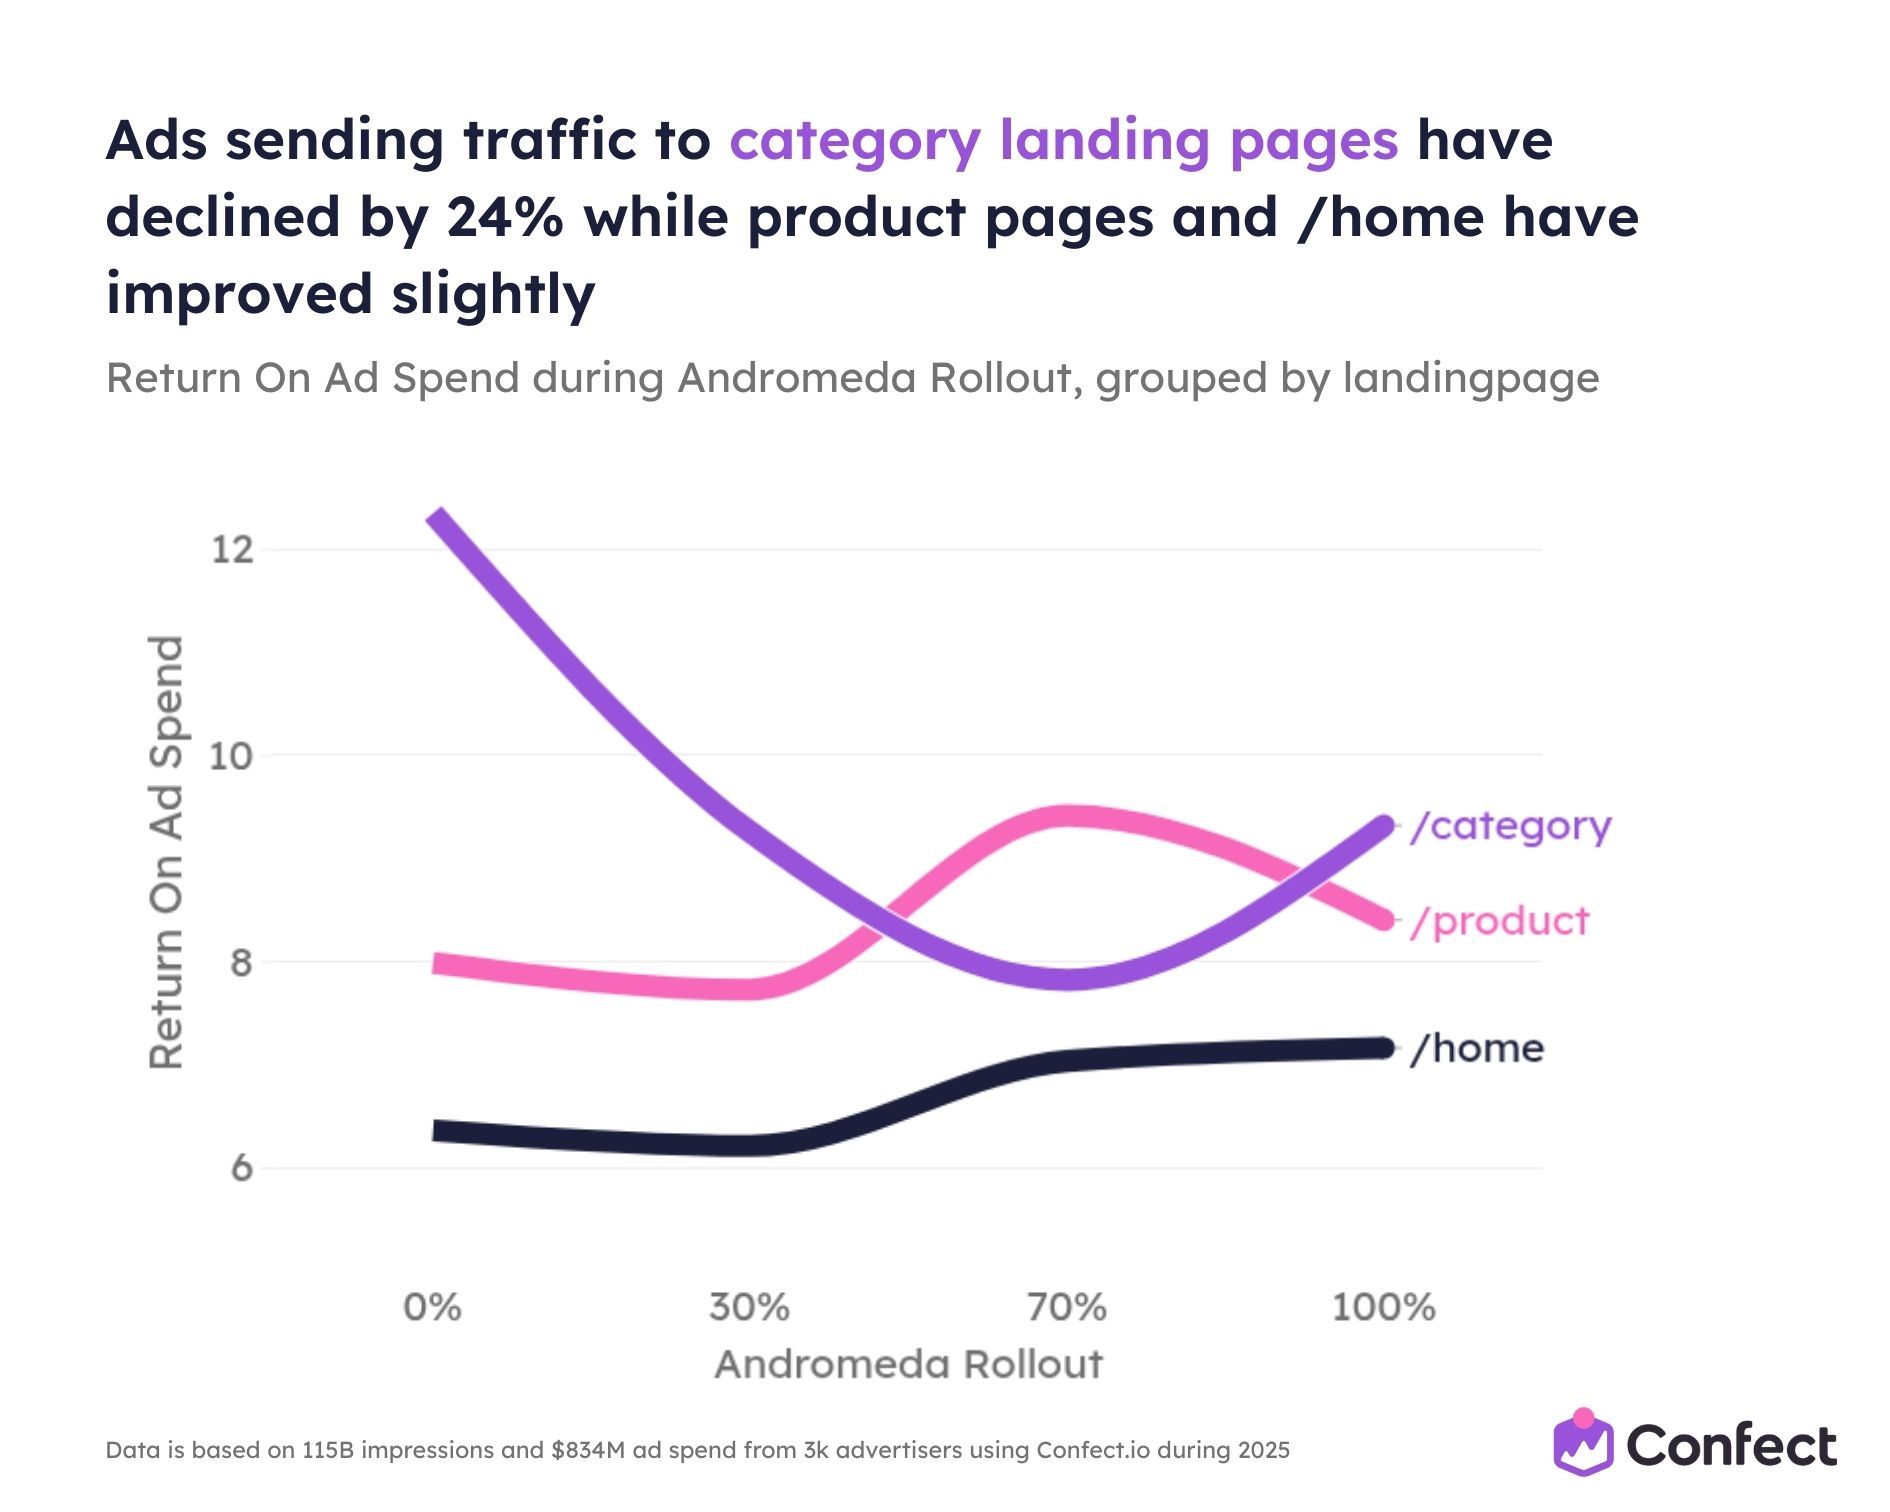
Category pages were the dominant landing page type before Andromeda, starting at approximately 12.5 ROAS. By full rollout, they had collapsed to roughly 9.5 - a 24% decline and the steepest single-variable drop in the study.
Meanwhile, product pages climbed from approximately 8 to around 9.0. Homepage destinations improved from roughly 6.5 to about 7.5. Both showed modest but consistent gains.
This is a complete inversion of the pre-Andromeda hierarchy.
Why? Andromeda delivers colder, top-of-funnel traffic that lacks brand context. Category pages present too many choices to users who don’t yet know what they’re looking for, creating decision paralysis and higher bounce rates. Product pages work better because they provide a focused, single-product experience that matches the item shown in the ad. Homepages work better because they typically include brand storytelling, social proof, and bestseller highlights that help cold audiences build the confidence to explore further.
Catalog Ads have a structural advantage here. They automatically link each product creative to its specific product page, ensuring perfect ad-to-page relevance without manual landing page management across hundreds of ads.
Multi-creative formats are weathering Andromeda best
Andromeda has created a clear hierarchy of ad formats.
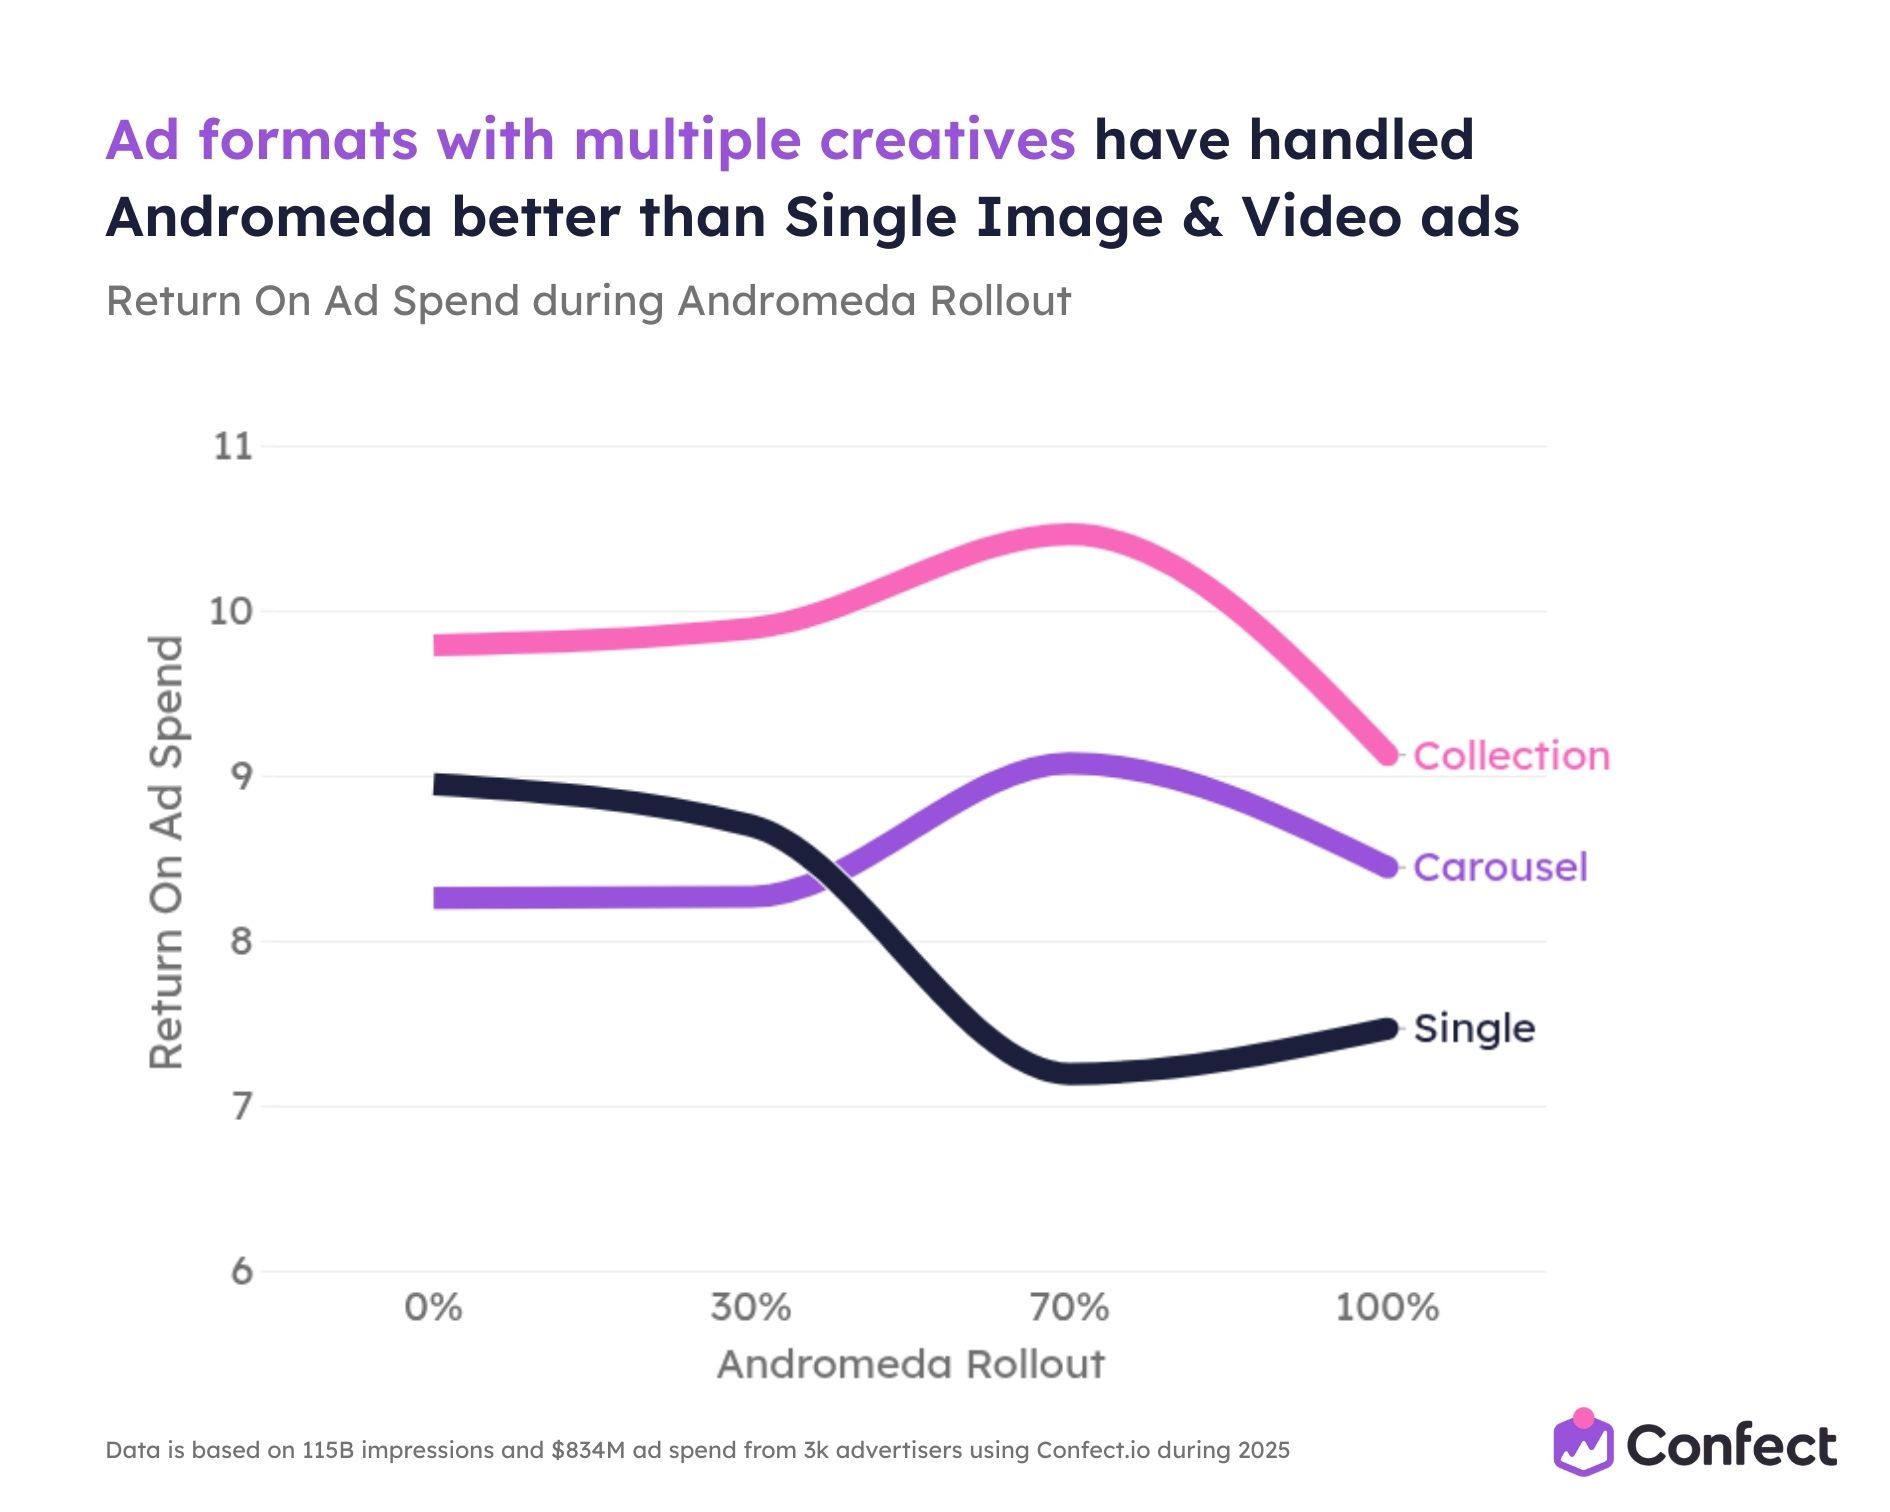
Single Image and Video ads dropped from approximately 9 ROAS to roughly 7.5 - a 17% decline that makes them the worst-performing format under Andromeda.
Collection ads started at approximately 9.8, peaked above 10.5 at the 70% rollout mark, and settled at roughly 9.2 at full rollout, showing the most resilience.
Carousel ads held relatively steady, starting at approximately 8.3 and settling at about 8.5 at full rollout. A modest net improvement.
The gap between Collection and Single formats widened from less than 1 ROAS point pre-Andromeda to nearly 2 points at full rollout. The format choice penalty has effectively doubled.
This aligns directly with Andromeda’s core design: the algorithm rewards creative diversity, and multi-creative formats inherently provide multiple visual signals within a single ad unit. A Carousel ad with 10 genuinely different product cards gives the retrieval engine 10 distinct visual touchpoints. A Single Image ad gives it one.
Bigger catalogs win: 5,000+ products as a competitive moat
Catalog size is now a competitive advantage under Andromeda.
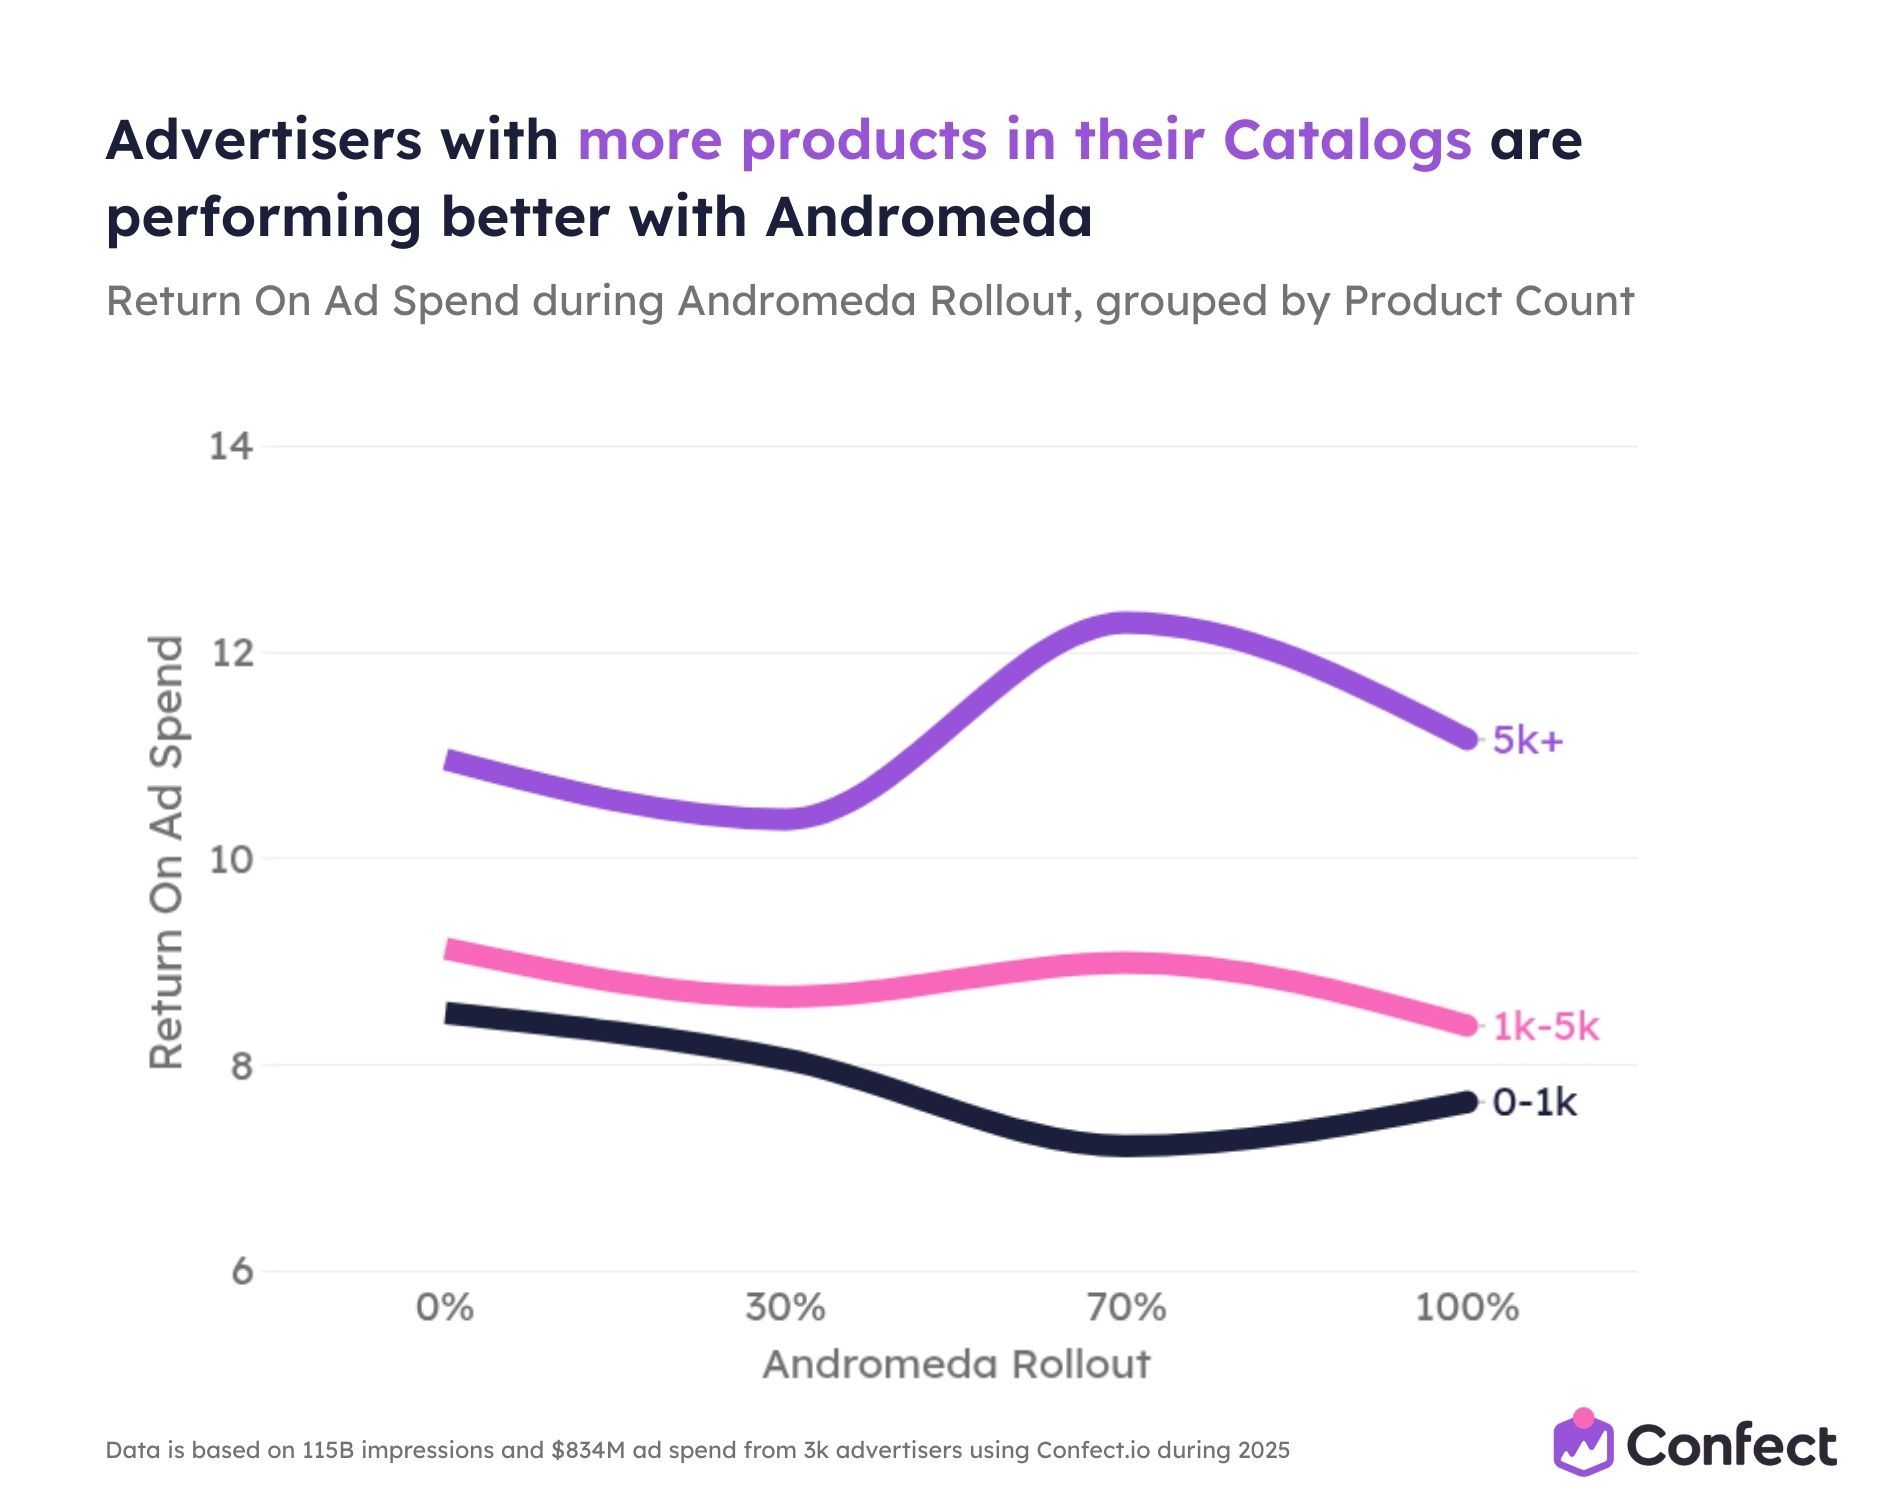
Advertisers with 5,000 or more products in their catalogs maintained the highest ROAS throughout the rollout, starting at approximately 11.0, peaking near 12 at 70% rollout, and settling back at roughly 11 at full deployment.
The 1,000–5,000 product group remained relatively stable, hovering between 8.5 and 9.0.
Small catalog advertisers with fewer than 1,000 products declined from approximately 8.5 to roughly 7.5 - confirming they’re increasingly disadvantaged.
The performance gap between the largest and smallest catalog groups widened from approximately 2.5 ROAS points pre-Andromeda to nearly 3.5 points at full rollout. Catalog size is becoming a progressively stronger differentiator.
Every product in your catalog is essentially a unique creative that Andromeda can match to a distinct user segment. A catalog with 5,000 products gives the algorithm 5,000 entry points. A static ad account with 20 creatives gives it 20 - or fewer, once entity clustering kicks in.
This finding has profound strategic implications. Catalog size isn’t something you can fake or quickly fix. Andromeda structurally favors retailers and brands with broad product assortments over niche single-product businesses.
For small catalog advertisers: compensate by maximizing creative diversity through multiple Catalog Ad variants with different designs, overlays, and formats for the same product set. A 500-product catalog with 3 design variants gives you 1,500 creative entities. A meaningful step toward closing the gap.
The surprising decline of product field enrichment
This one is counterintuitive.
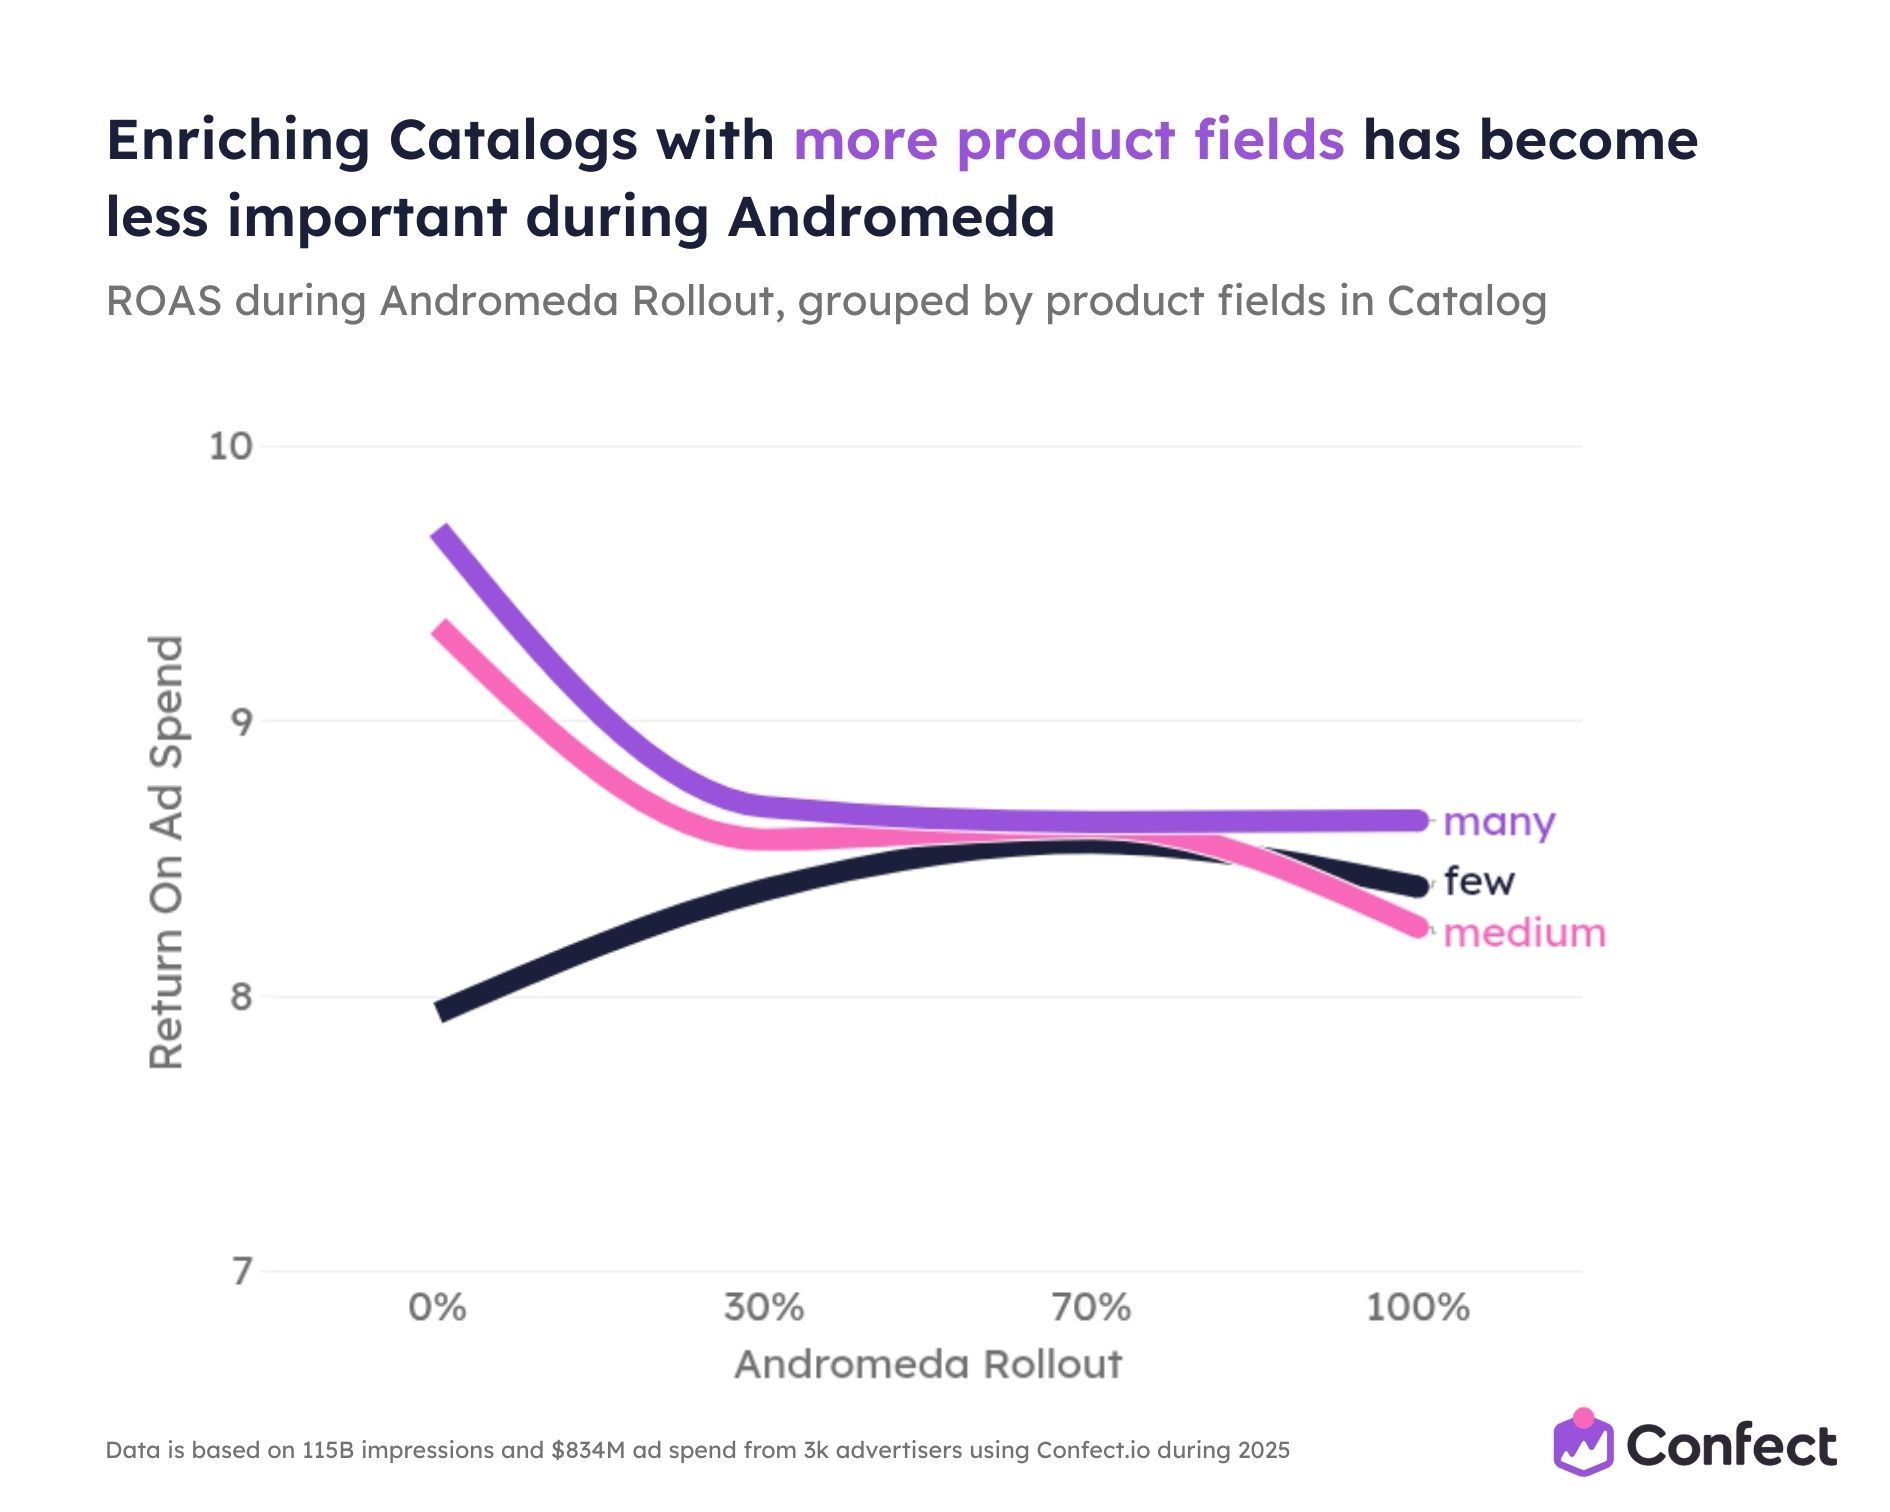
Enriching your product catalog with more data fields - which was considered best practice before Andromeda - has become significantly less important.
Catalogs with many product fields (25+) started highest at approximately 9.7 ROAS but declined to roughly 8.6 at full rollout. Catalogs with few fields (under 15) started lowest at approximately 8 but actually improved to roughly 8.5. By full rollout, all three groups sit within a narrow 0.3 ROAS band compared to a 1.7-point spread before Andromeda.
The enrichment advantage has essentially evaporated.
Why? Andromeda’s retrieval engine relies primarily on computer vision and semantic analysis of the ad creative itself - not on structured product feed metadata. The system can now infer product type, style, color, and context directly from the product image, without needing those attributes spelled out in the feed.
This doesn’t mean product data is irrelevant. Accurate core fields like title, price, and availability still matter for basic functionality. But the relative priority of feed enrichment has dropped compared to other levers like creative diversity, catalog size, and ad format selection.
For resource-constrained teams, this is a liberating finding. Your time is better spent producing diverse creative variants and expanding your product count than obsessively perfecting every custom label and product attribute.
The bottom line
Andromeda has suppressed performance broadly but the impact varies wildly depending on who you are and what you’re doing.
The worst hit: top performers, big advertisers, affordable products, single image/video ads, category landing pages, and small catalogs.
The most resilient - and in some cases improved: mid-sized advertisers, mid-priced products, multi-creative formats, product page destinations, and large catalogs.
The pattern is consistent across every dimension we measured. Andromeda rewards creative diversity, punishes repetition, favors product-level relevance, and sends broader, colder traffic that demands a different post-click experience.
The question is: what are the advertisers who are winning under Andromeda actually doing differently?
That’s what we’ll look at next.
What Top Performers Are Doing Differently
Chapter 3 painted a tough picture. But the data also tells a very clear story about what separates the advertisers who are winning under Andromeda from those who are falling behind.
The gaps are not small. And they’re not random. They follow a pattern that shows up across every metric we measured.
Let’s walk through it.
They’re running 33% more ads
The top-performing third of advertisers run 395 live ads on average. The bottom third runs 296.
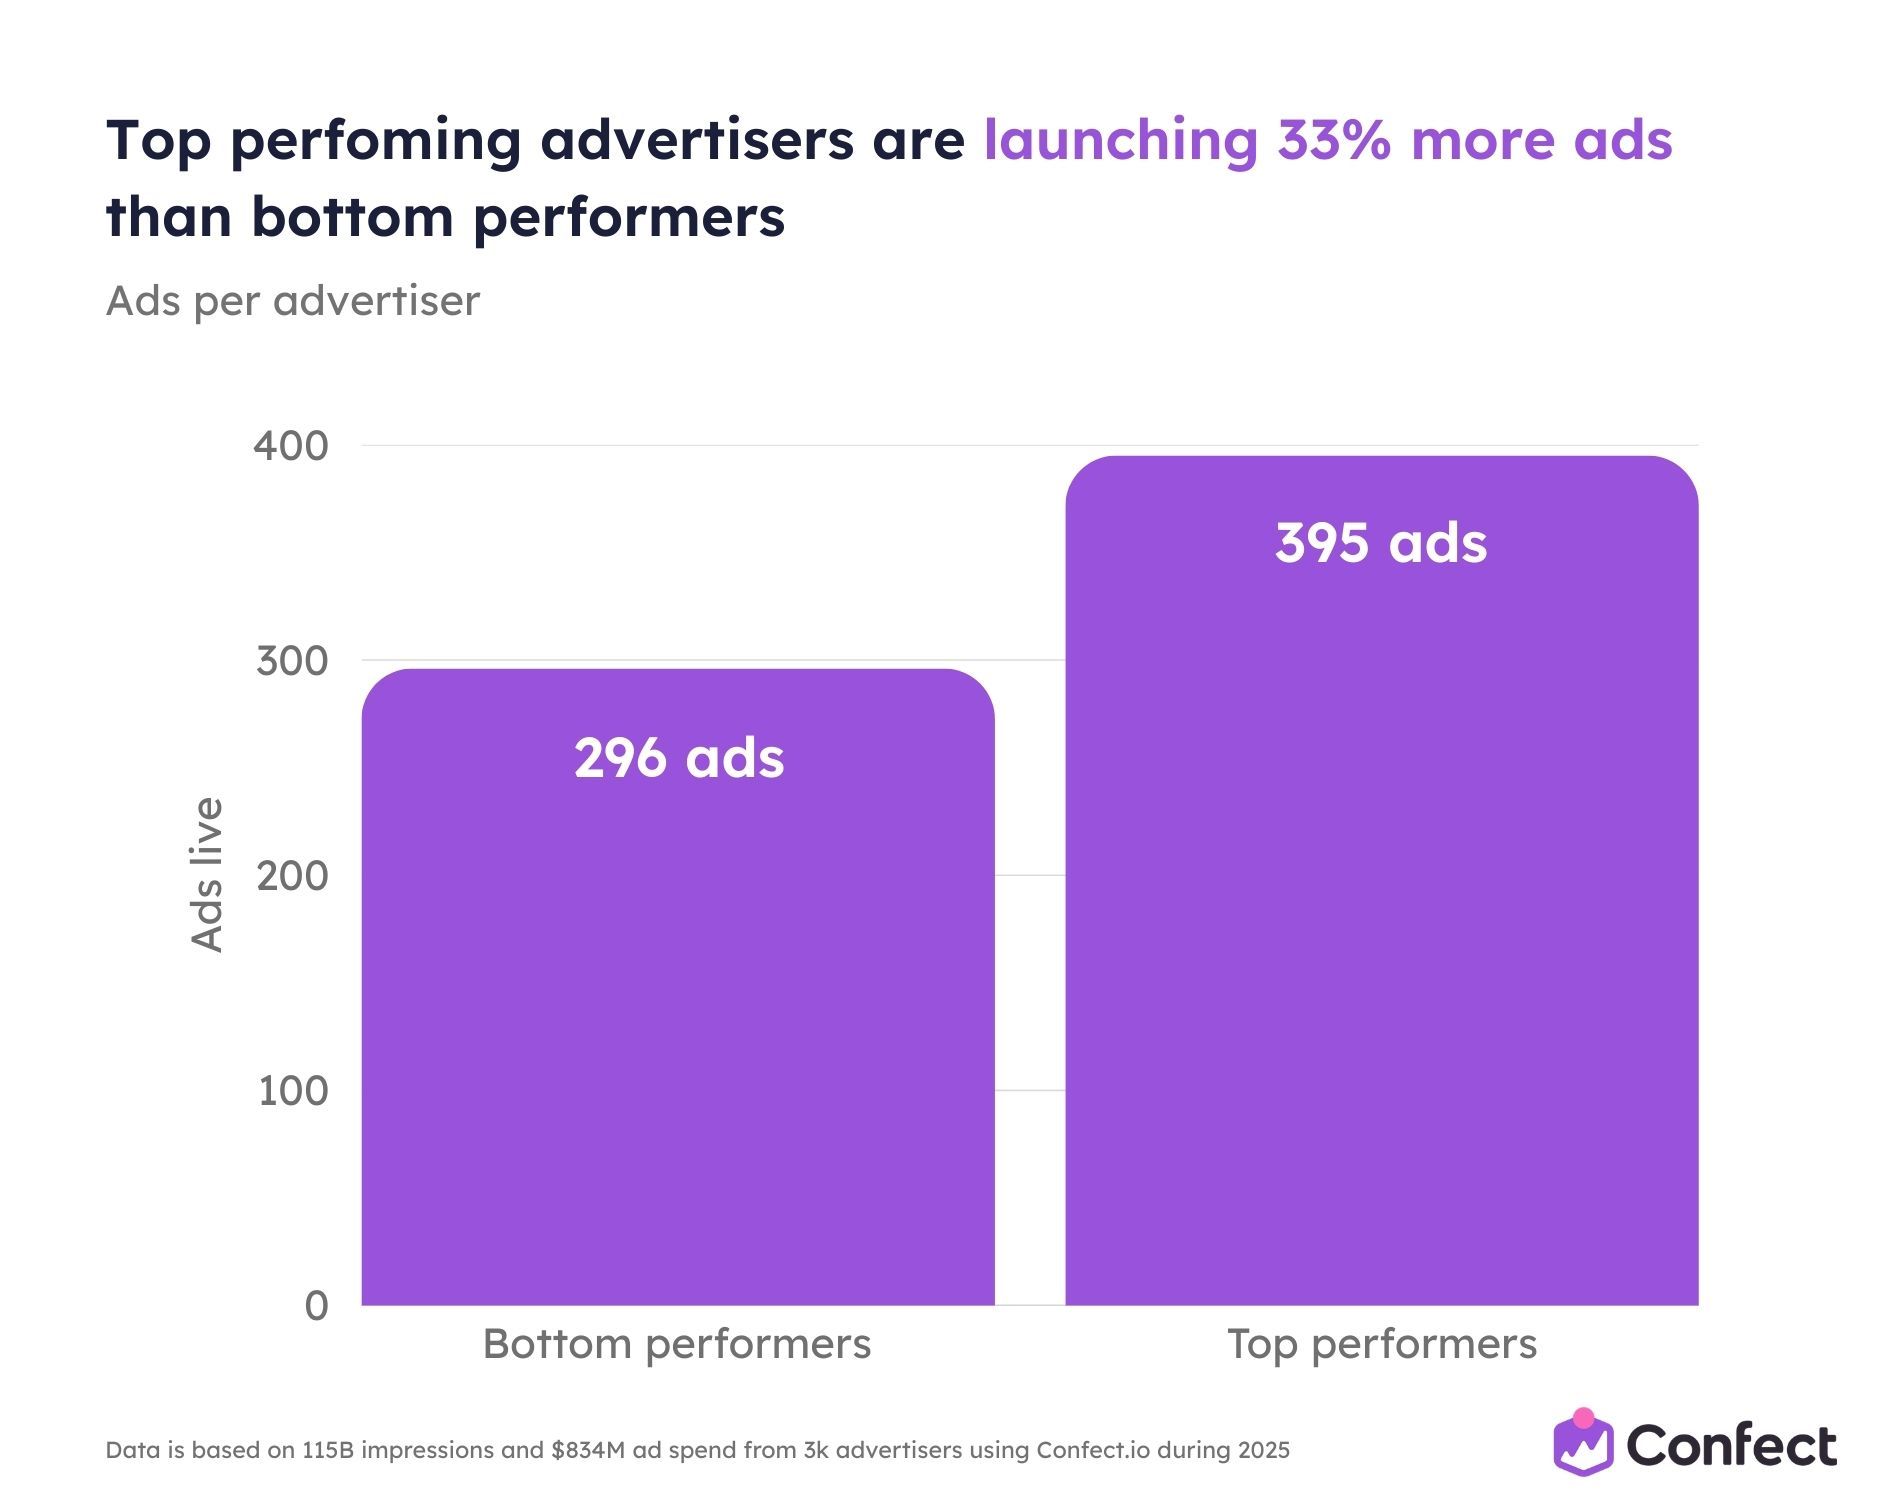
That’s a 33% gap - roughly 99 additional live ads at any given time.
This isn’t about throwing more money at the problem. It’s about giving Andromeda’s retrieval engine more creative options to work with. Each genuinely distinct creative gets its own path through the auction. More diverse ads means more chances to be matched with different user segments.
The 99-ad gap compounds over millions of impressions into a significant structural delivery advantage. When any single ad declines after its first-week peak, top performers already have dozens of alternatives ready to absorb that lost delivery. Bottom performers are still relying on a handful of long-running creatives, exactly the pattern Andromeda penalizes.
But here’s the thing: volume without diversity is counterproductive. Andromeda clusters similar-looking ads into a single entity, so 395 ads that all look the same perform no better than 10. The focus has to be on genuinely distinct concepts.
They’re running 72% more Catalog Ads
The ad volume gap gets far more dramatic when you look at Catalog Ads specifically.
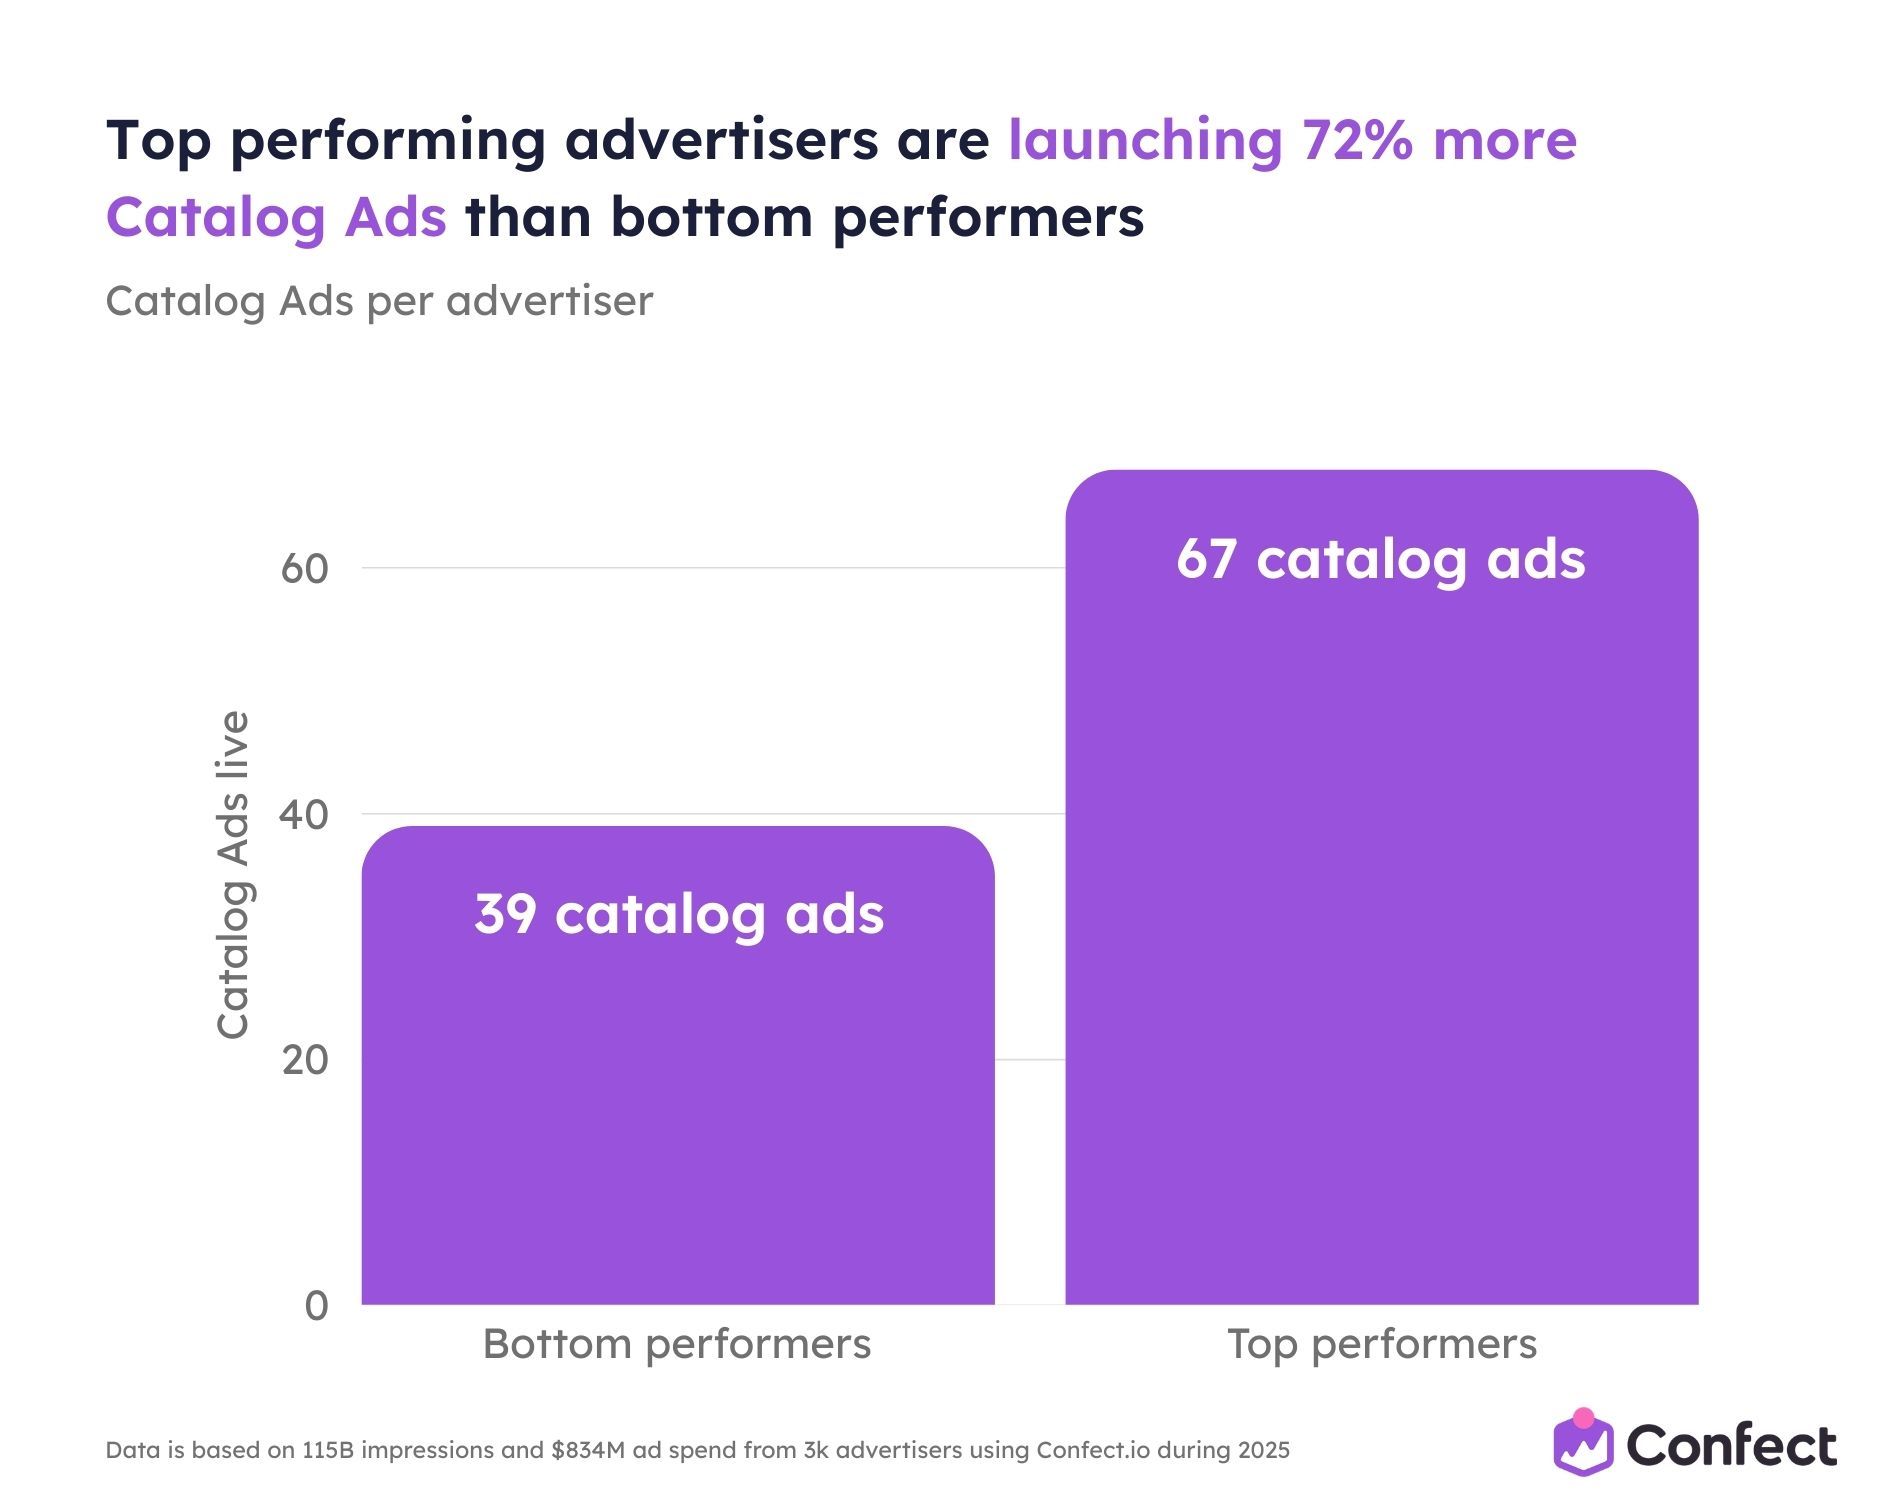
Top performers run 67 live Catalog Ads. Bottom performers run 39. That’s a 72% gap - more than double the 33% gap in total ad volume.
This is the clearest signal in the study. Top performers aren’t just running more ads overall. They’re deliberately over-indexing on Catalog Ads specifically.
Why? Because Catalog Ads provide automatic creative diversity at the product level. Each Catalog Ad creative features a unique product image, title, and price that Andromeda treats as a separate entity. A single catalog ad backed by a 2,000-product catalog creates thousands of distinct retrieval opportunities without requiring manual production for each one.
Catalog Ads also solve the creative fatigue problem structurally. As inventory changes, new products enter the catalog and old ones rotate out, providing continuous novelty without manual creative refreshes.
If you currently have fewer than 39 live Catalog Ads, you’re performing below even the bottom performer benchmark.
They’re spending 117% more on Catalog Ads
It’s not just about running more Catalog Ads. Top performers are putting significantly more budget behind them.
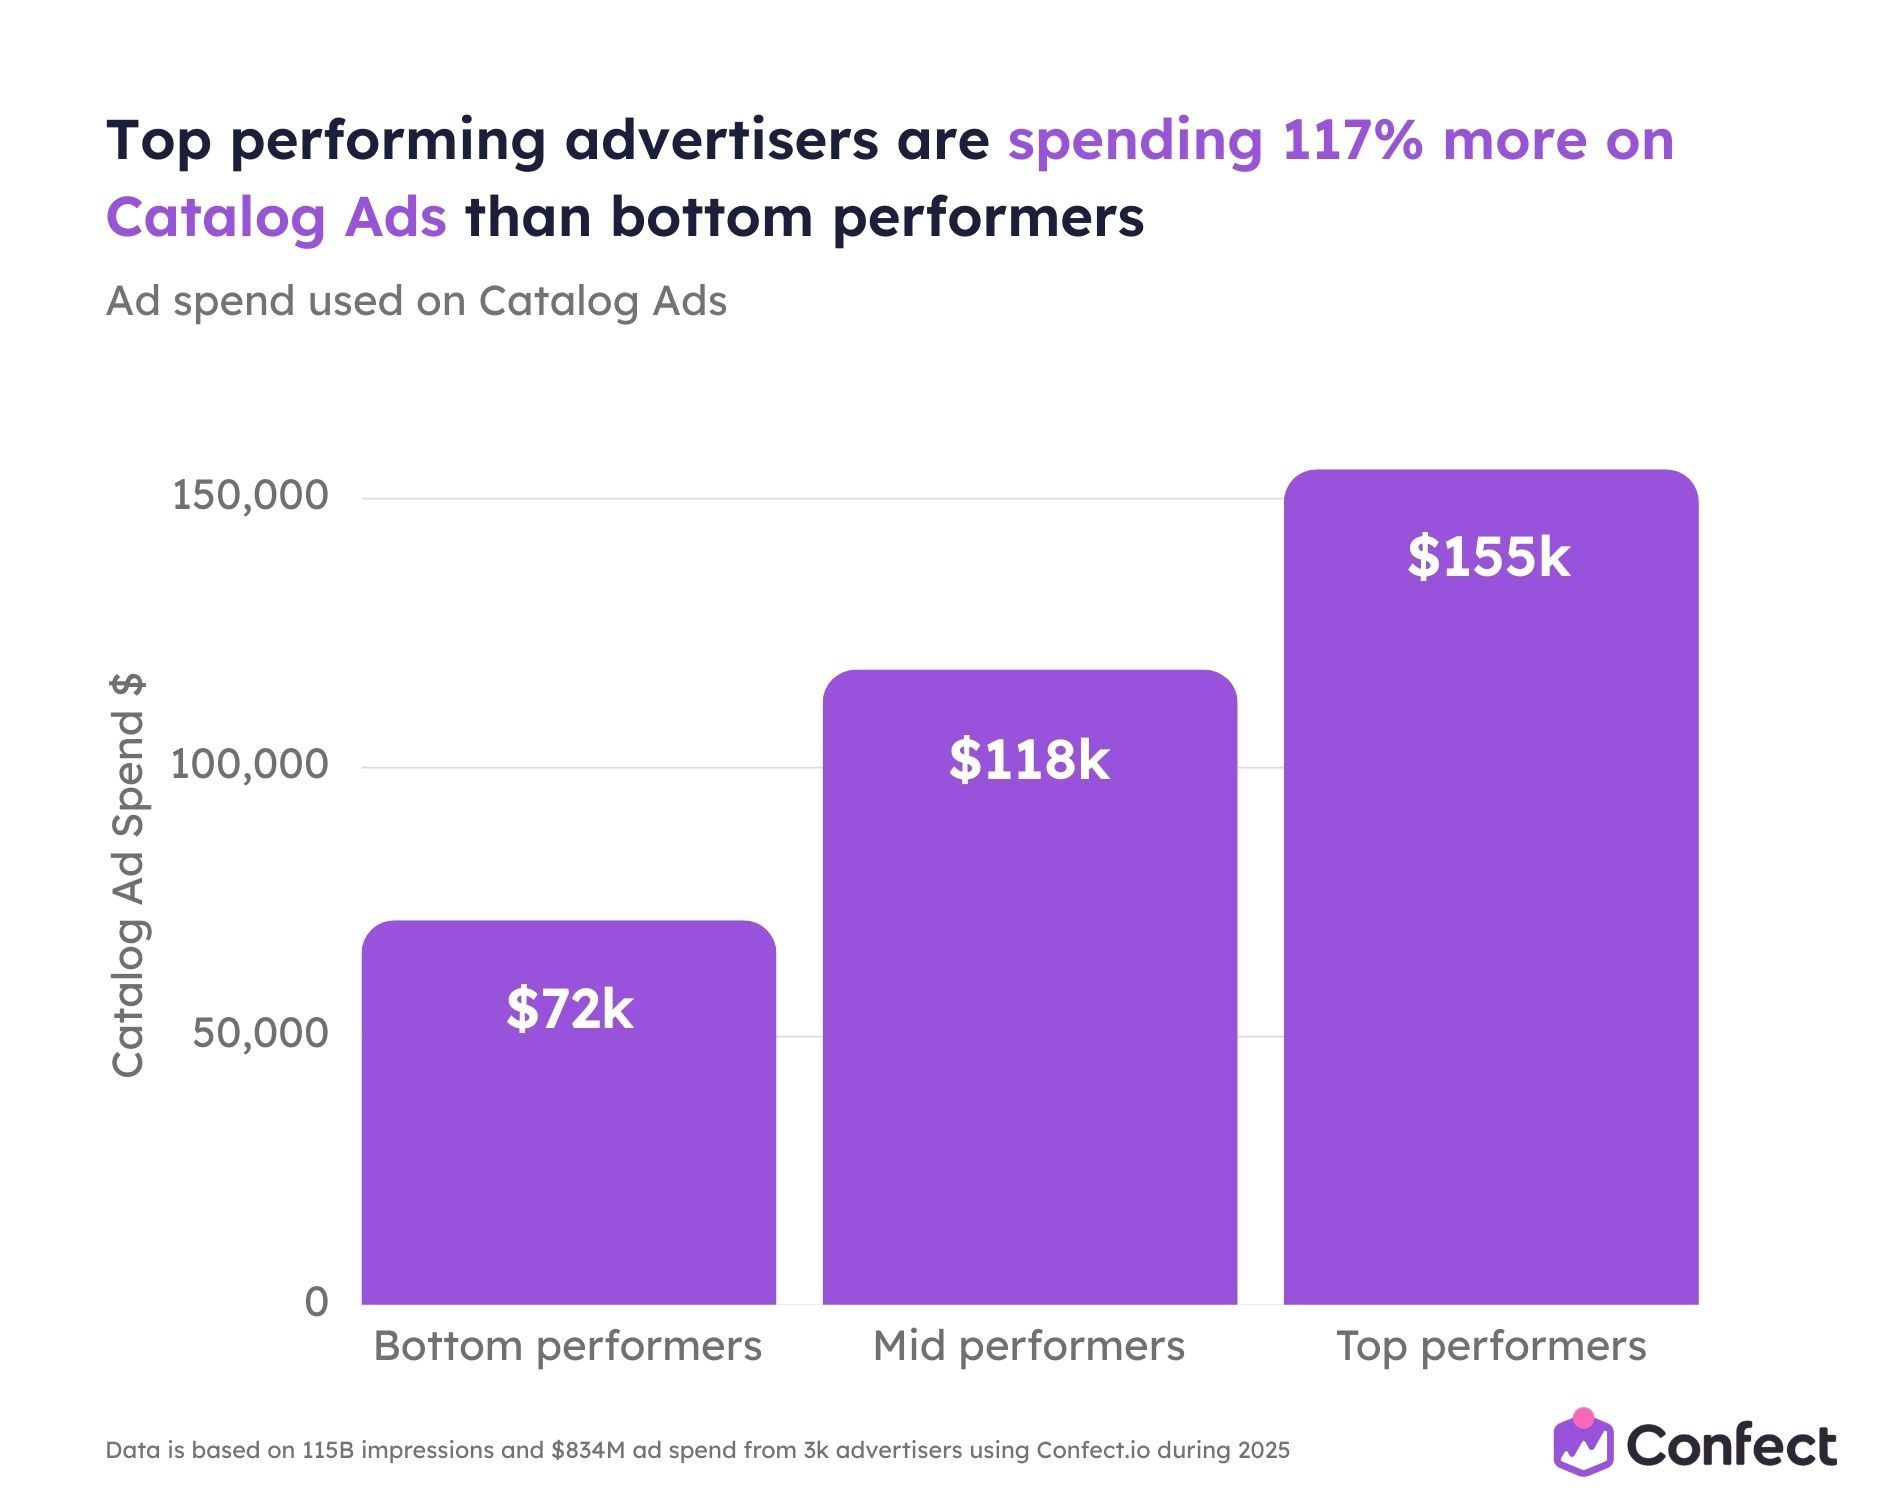
Top performers invest $155,000 on Catalog Ads annually, compared to $72,000 for bottom performers - a 117% gap. Mid performers sit at $118,000, creating a near-linear staircase from bottom to top.
This isn’t simply a function of bigger budgets. Performance groups are defined by ROAS within their industry, not by total spend. These advertisers are choosing to put more money behind Catalog Ads regardless of their overall budget size.
The three-part picture is now complete: top performers run 33% more ads overall, 72% more Catalog Ads specifically, and allocate 117% more budget to Catalog Ads. It’s a compounding commitment at every level.
They get 60% of their revenue from Catalog Ads
This is the revenue headline.
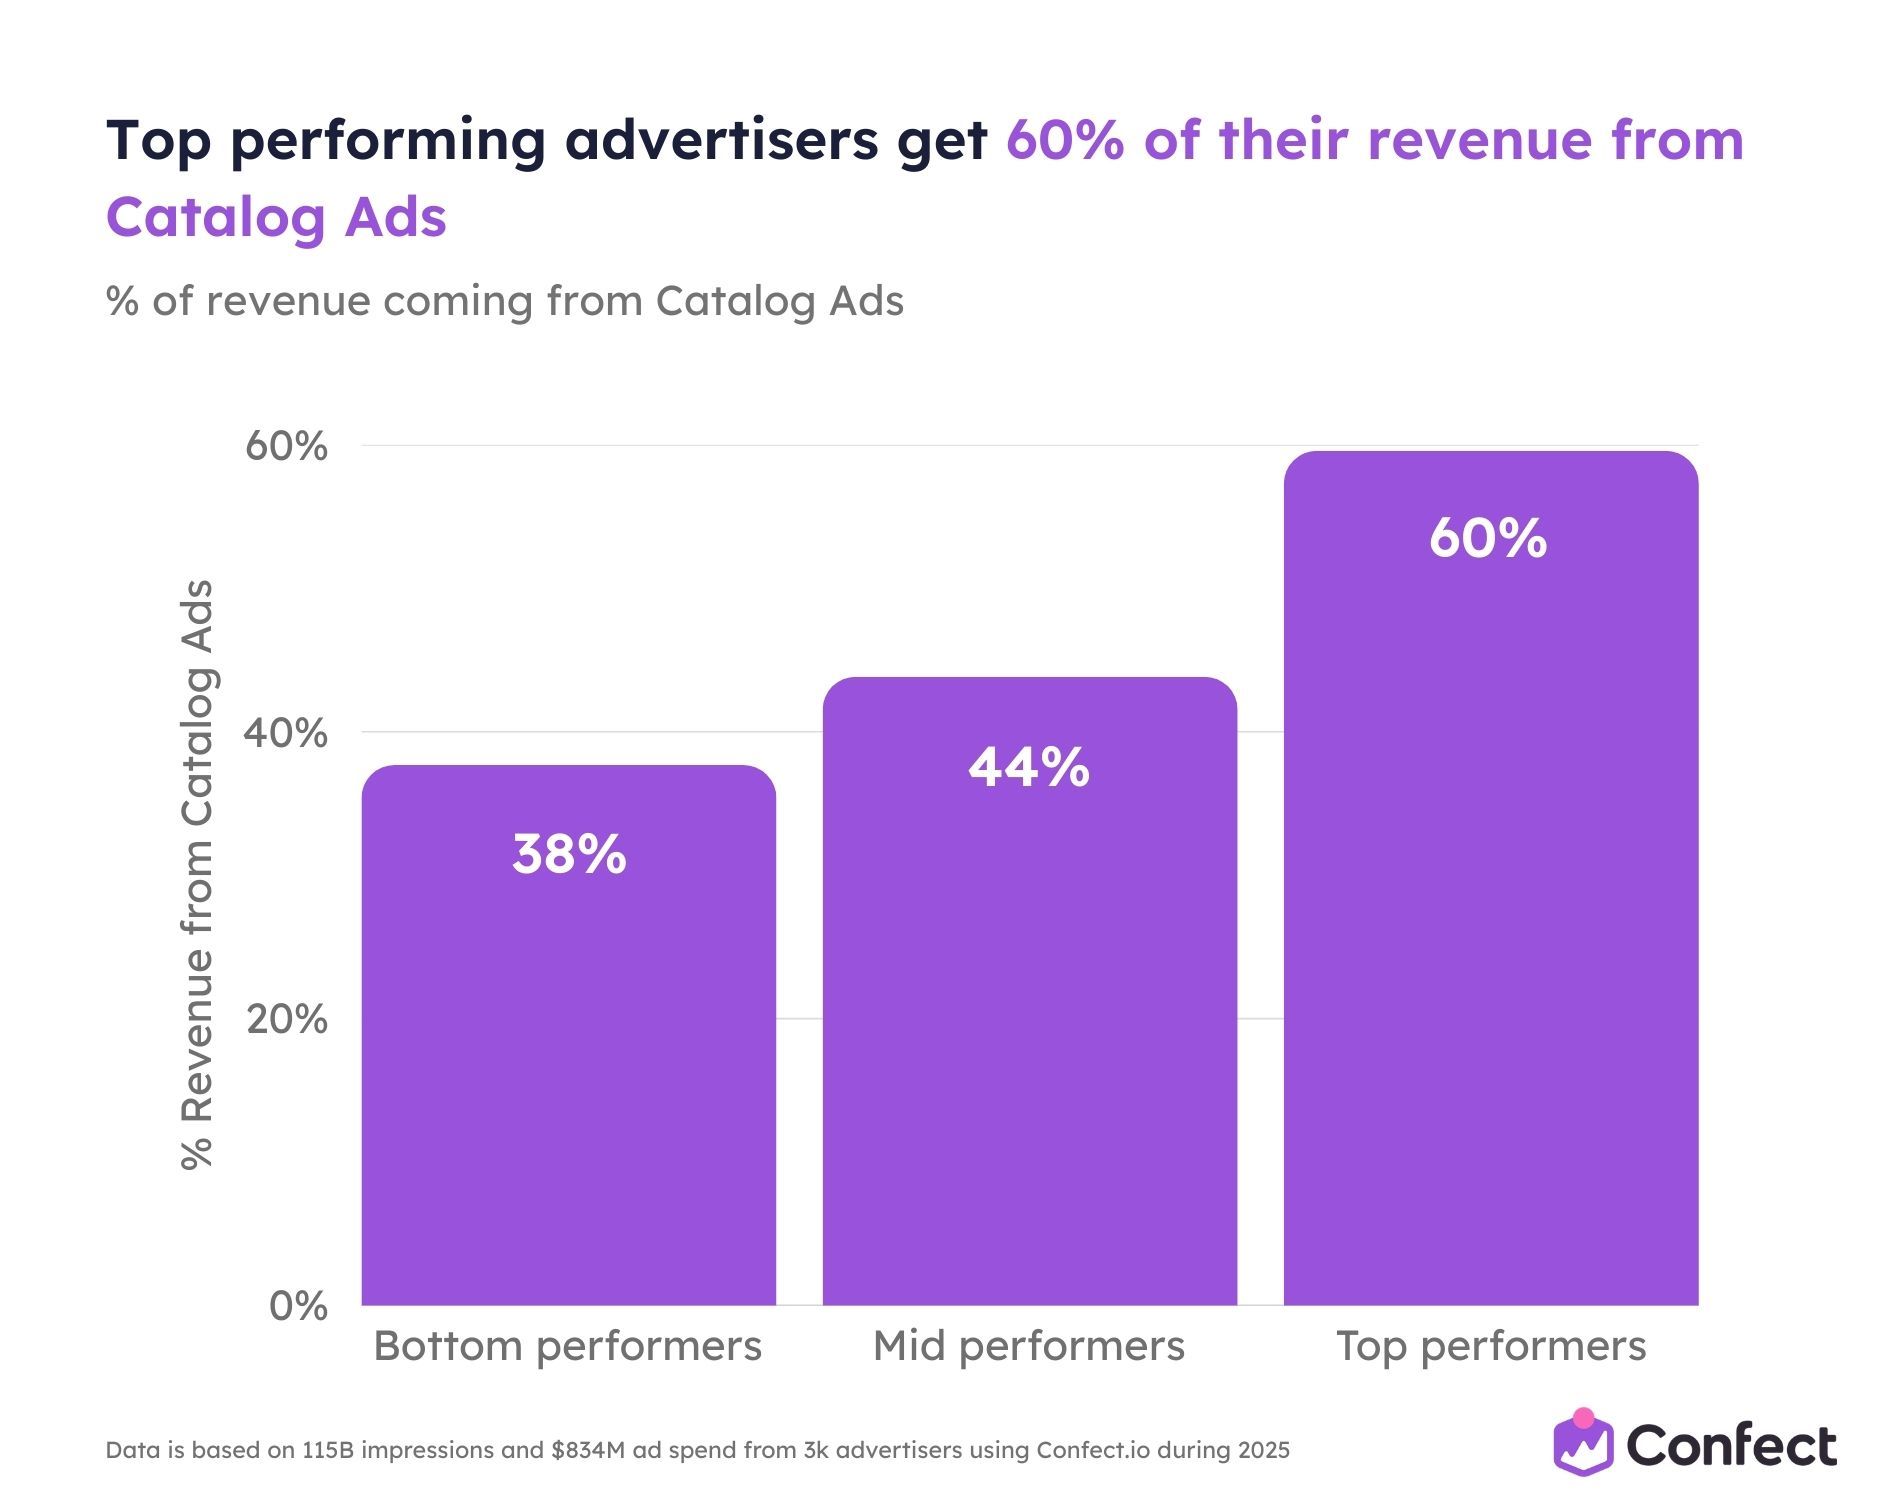
Top-performing advertisers generate 60% of their total ad revenue from Catalog Ads. Bottom performers generate 38%. That’s a 22 percentage point gap that represents a fundamentally different business model for paid social.
Catalog Ads are no longer a supplementary retargeting tactic for the best advertisers. They are the majority revenue engine, driving more than half of all sales generated through Meta advertising.
The staircase from 38% to 44% to 60% mirrors the spend pattern, but the revenue share exceeds the spend share at every level. Catalog Ads return disproportionately more revenue per dollar invested.
If Catalog Ads represent less than 40% of your revenue, you’re leaving significant money on the table.
The head-to-head: Catalog Ads vs. Static Ads
So why are Catalog Ads outperforming? Let’s look at the numbers side by side.
The average advertiser in this study produces 3.3 times more static ads than Catalog Ads (341 vs. 103). Yet each Catalog Ad generates 3.6 times more revenue ($30,553 vs. $8,438), 4 times more purchases (210 vs. 51), and nearly 3 times more impressions (475,871 vs. 160,419).
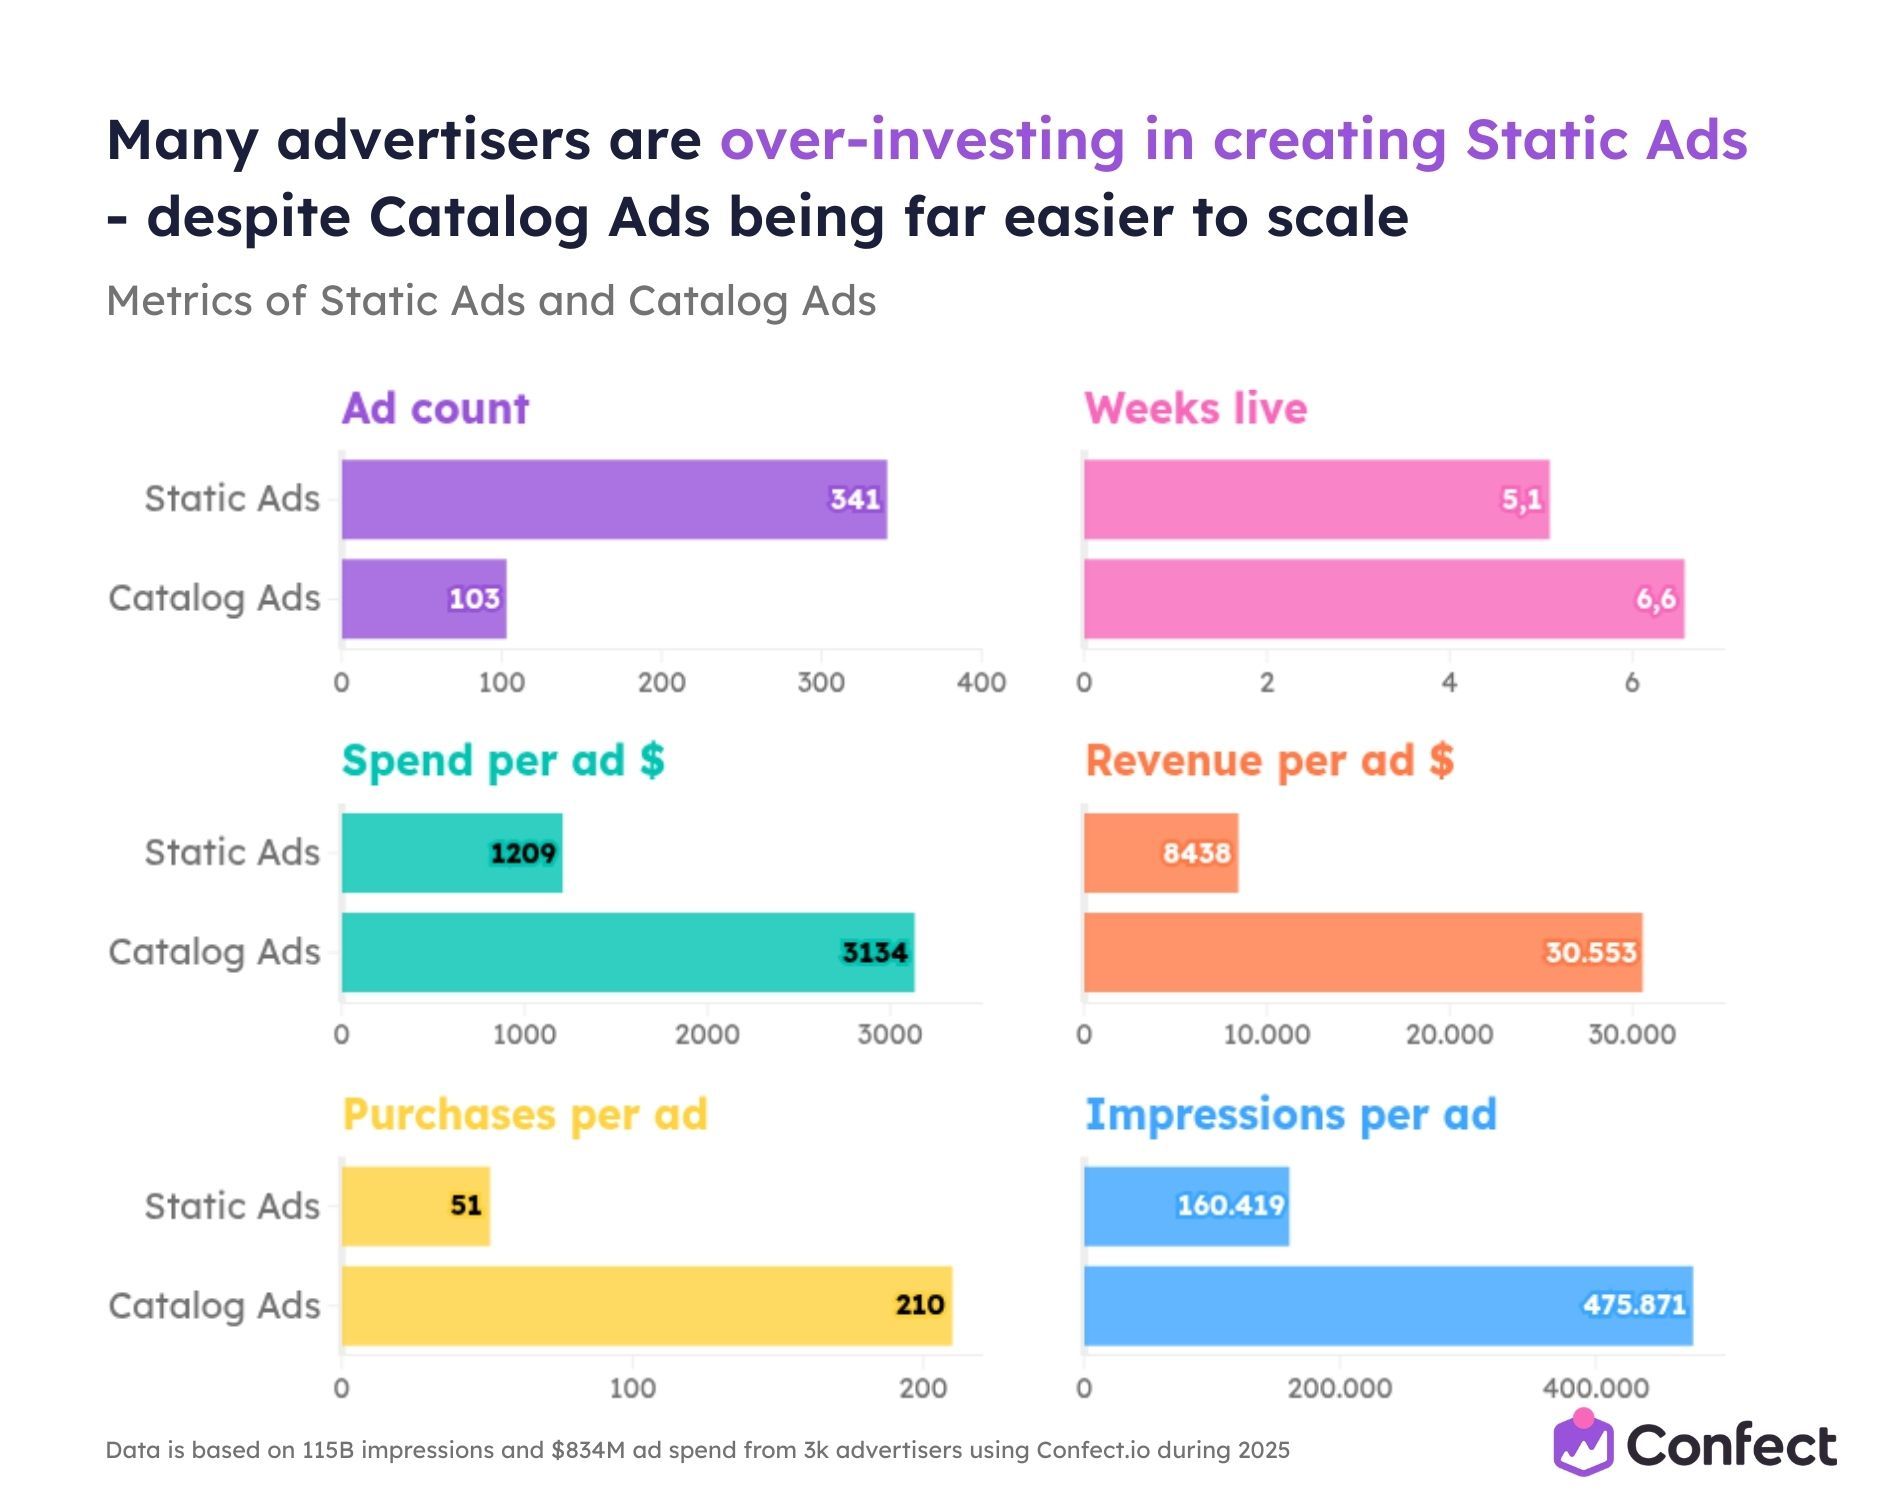
The industry is over-investing creative resources in the wrong format. The majority of creative production effort goes toward static ads; the lower-performing, harder-to-scale type.
One great Catalog Ad design template applied across 500 products generates more output than 50 individual static ads. And Catalog Ads stay live 30% longer on average (6.6 weeks vs. 5.1 weeks), because the product-level rotation provides natural novelty that delays fatigue.
Here’s the head-to-head on performance metrics:
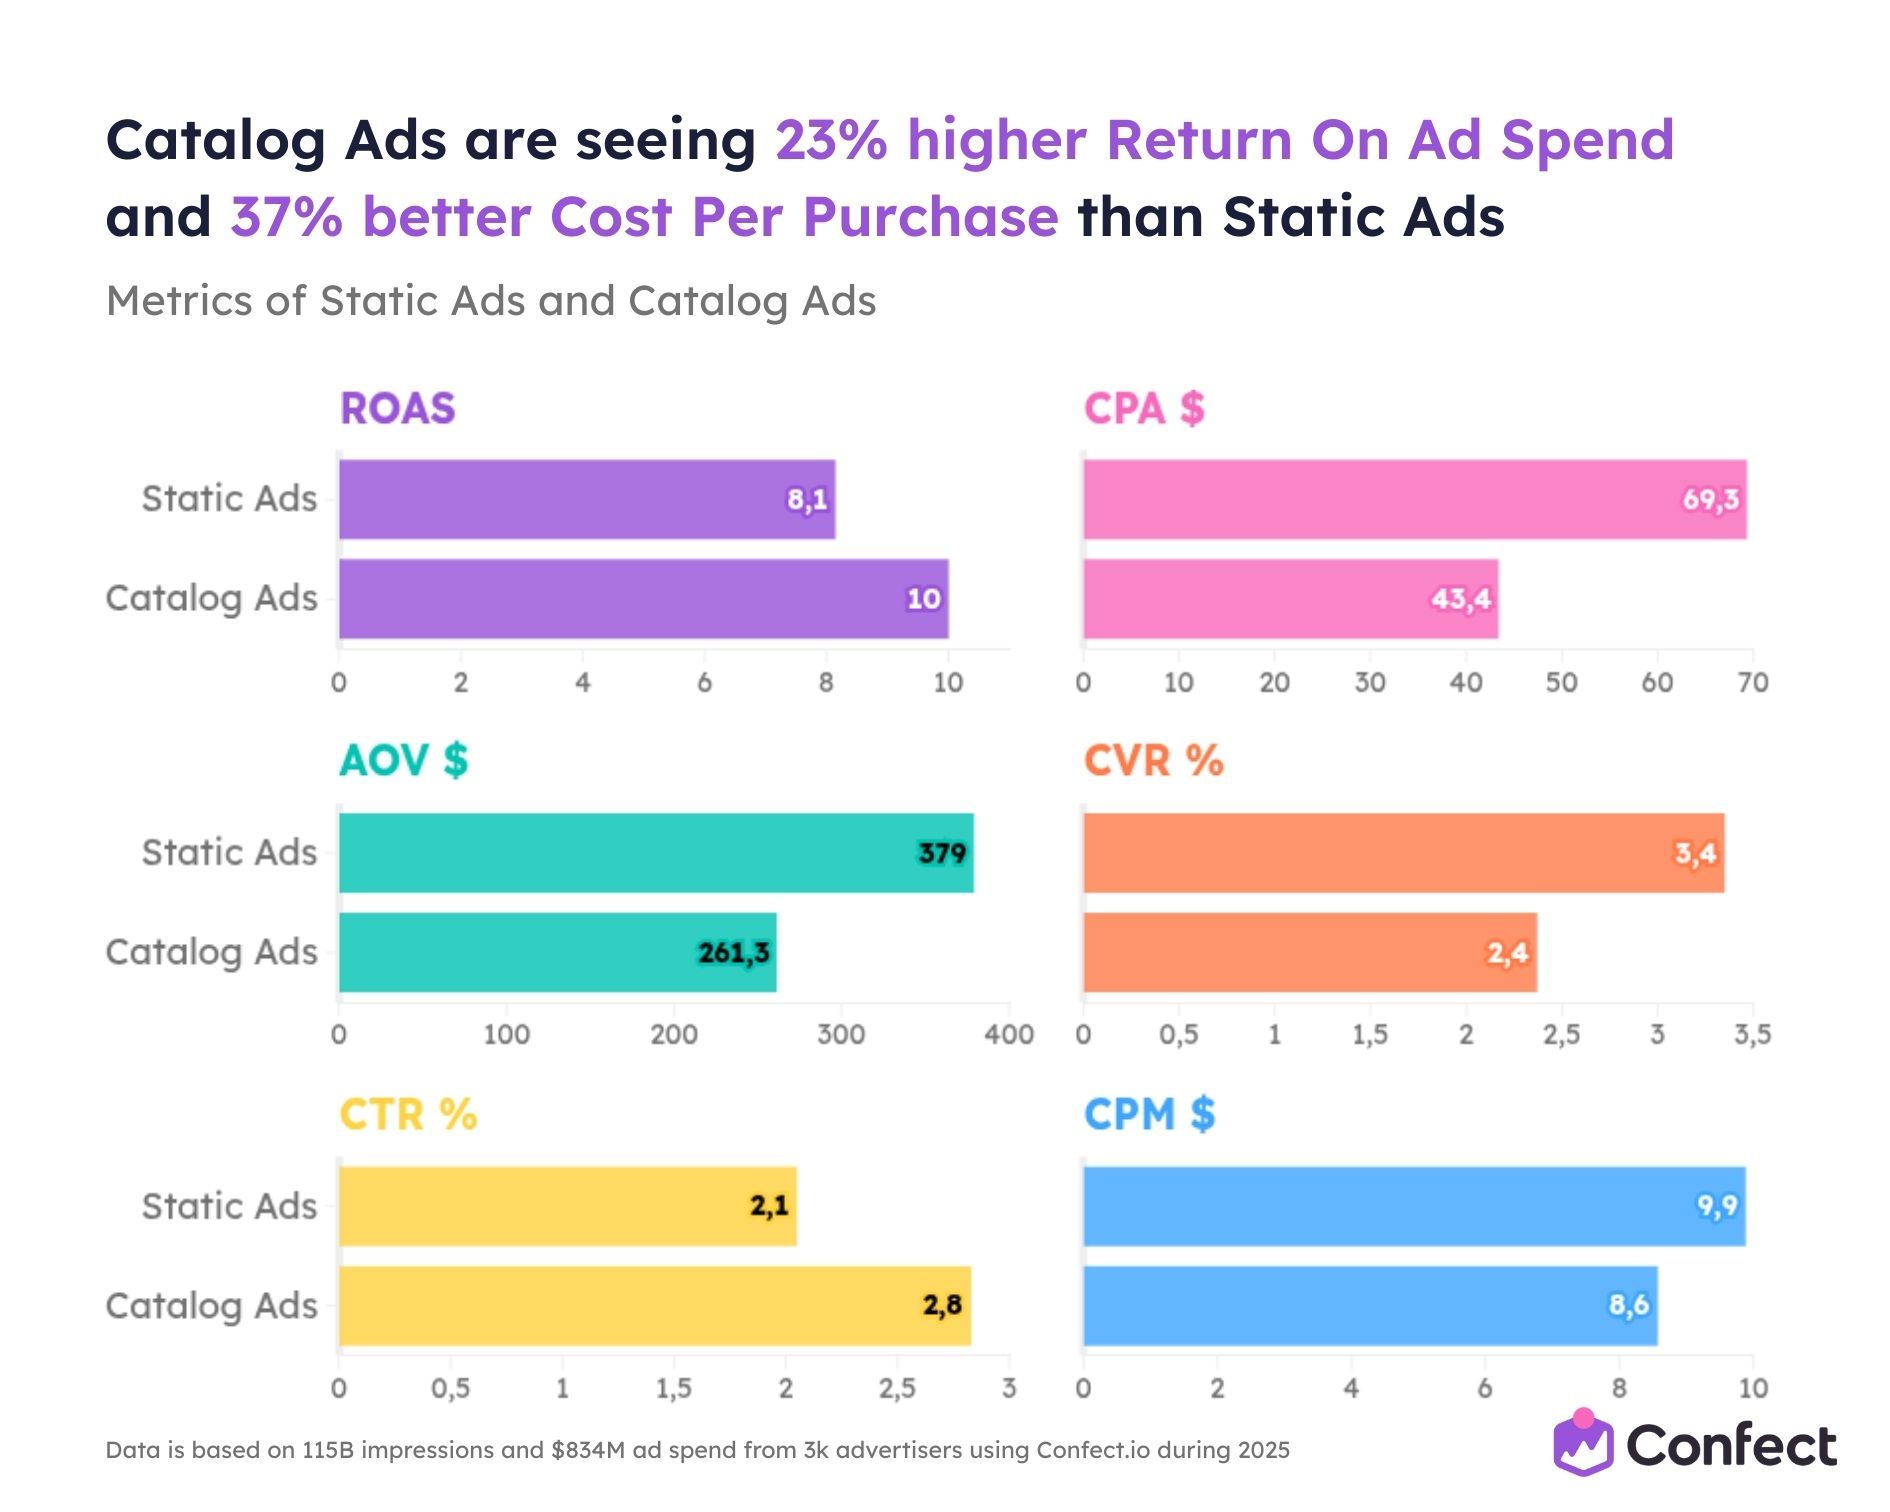
Catalog Ads win on the four metrics that matter most for profitability: ROAS, CPA, CTR, and CPM.
Static Ads lead on conversion rate and average order value but these advantages aren’t enough to offset the efficiency gains Catalog Ads deliver on cost and engagement. The lower conversion rate reflects that Catalog Ads are doing more prospecting work, reaching new audiences where conversion rates are naturally lower. The lower AOV means catalogs drive higher volumes of more accessible purchases rather than relying on fewer high-ticket conversions.
The net result: 23% better ROAS and 37% better CPA.
Don’t be alarmed by the lower conversion rate. The higher CTR and lower CPM mean you’re getting dramatically more traffic at a dramatically lower cost, and the math works out in Catalog Ads’ favor at the bottom line.
The spend curve: more Catalog Ads = better performance at every level
This is the single most actionable finding in the entire study.
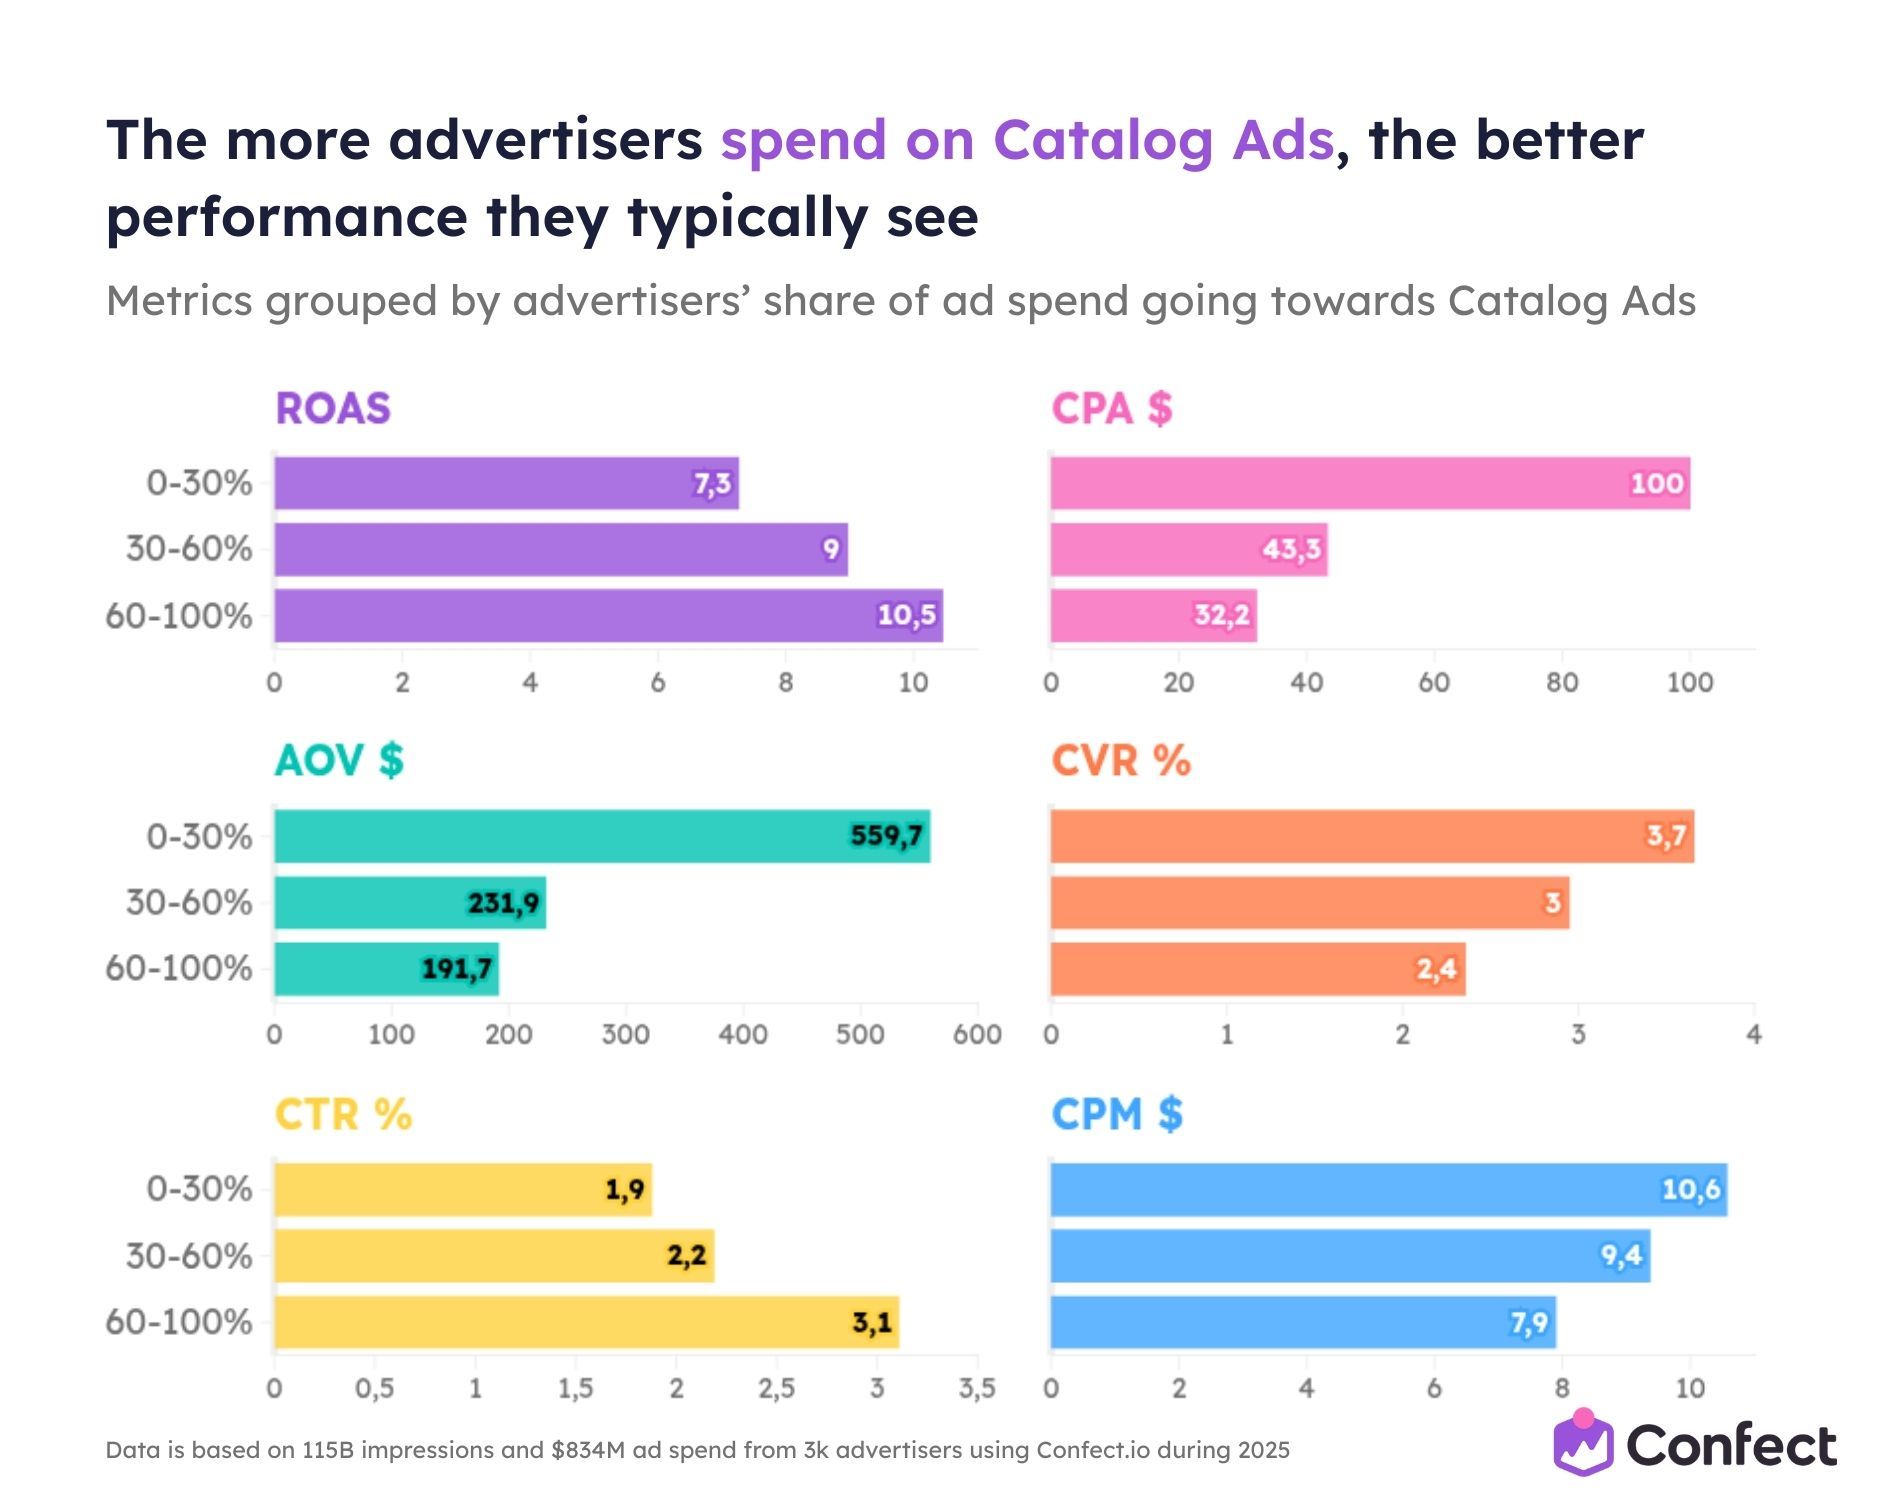
The more advertisers spend on Catalog Ads as a share of total budget, the better their performance across every key metric:
The relationship is not marginal. Advertisers allocating 60–100% of spend to Catalog Ads achieve 44% higher ROAS, 68% lower CPA, and 63% higher CTR compared to those spending less than 30%.
The CPA improvement is staggering. It drops from $100 to $32.2 - meaning the highest Catalog Ad allocators acquire customers for less than one-third the cost.
If you’re currently in the 0–30% tier, moving to 30–60% alone would cut your CPA by more than half. That’s the single highest-ROI budget decision available.
It works across every industry
You might wonder: does this just apply to certain product categories?
No. The Catalog Ad advantage holds across every single industry vertical in the study. Zero exceptions.
.jpg)
Electronics advertisers see the most dramatic uplift at 131%. Sports achieves the highest absolute ROAS at 16.9 for high Catalog Ad spenders. Even the lowest-performing vertical at high catalog spend (Food & Drinks at 8.6) still significantly outperforms the overall study average.
No matter what you sell, the data says the same thing: advertisers who allocate 60–100% of spend to Catalog Ads consistently outperform those spending under 30%.
It works across every advertiser size
The budget-size objection doesn’t hold up either.
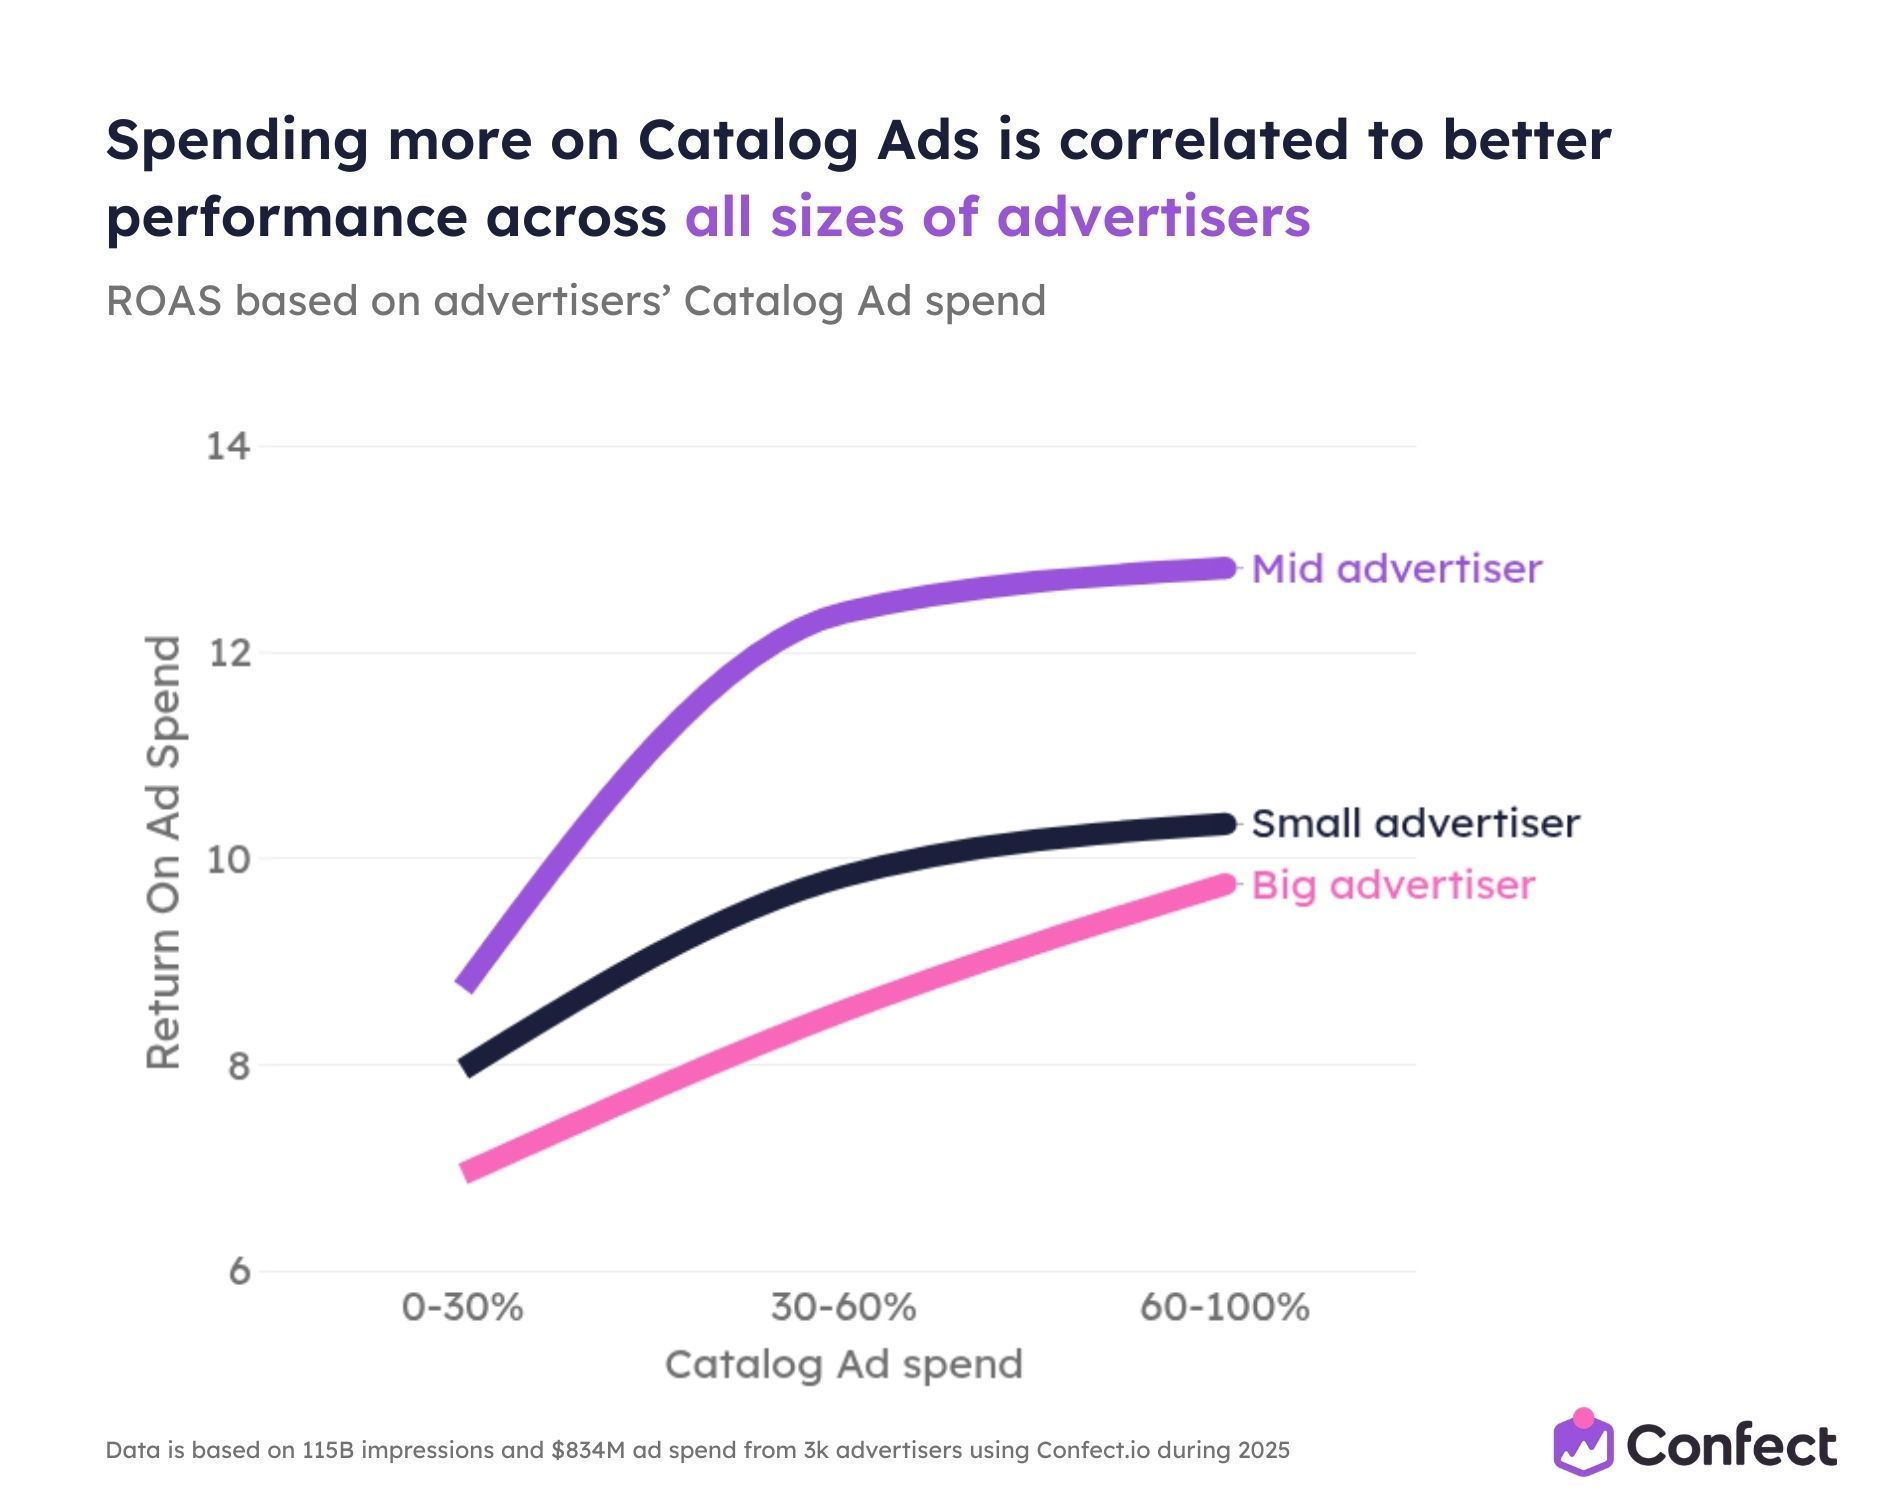
Increasing Catalog Ad spend improves ROAS for small, mid, and big advertisers alike.
Mid-sized advertisers benefit the most, climbing from approximately 8 ROAS at low catalog spend to 13 at high, a 63% improvement. This connects directly to Chapter 3: mid-sized advertisers were already outperforming under Andromeda, and now we see the mechanism. They’re combining their natural agility with heavier Catalog Ad investment.
Big advertisers, identified as the most impacted by Andromeda in Chapter 3, see meaningful recovery from 7 to nearly 10 ROAS when they shift to high Catalog Ad spend. Catalog Ads offer a structural workaround for their biggest problem (slow creative approval) because product catalogs generate diversity automatically, without requiring manual production or approval cycles.
Small advertisers see consistent gains from 8 to 10.5, a 31% uplift that maximizes the impact of every limited dollar.
Catalog Ads work across the entire funnel
One of the most persistent myths about Catalog Ads is that they’re a retargeting-only format. The data destroys this completely.
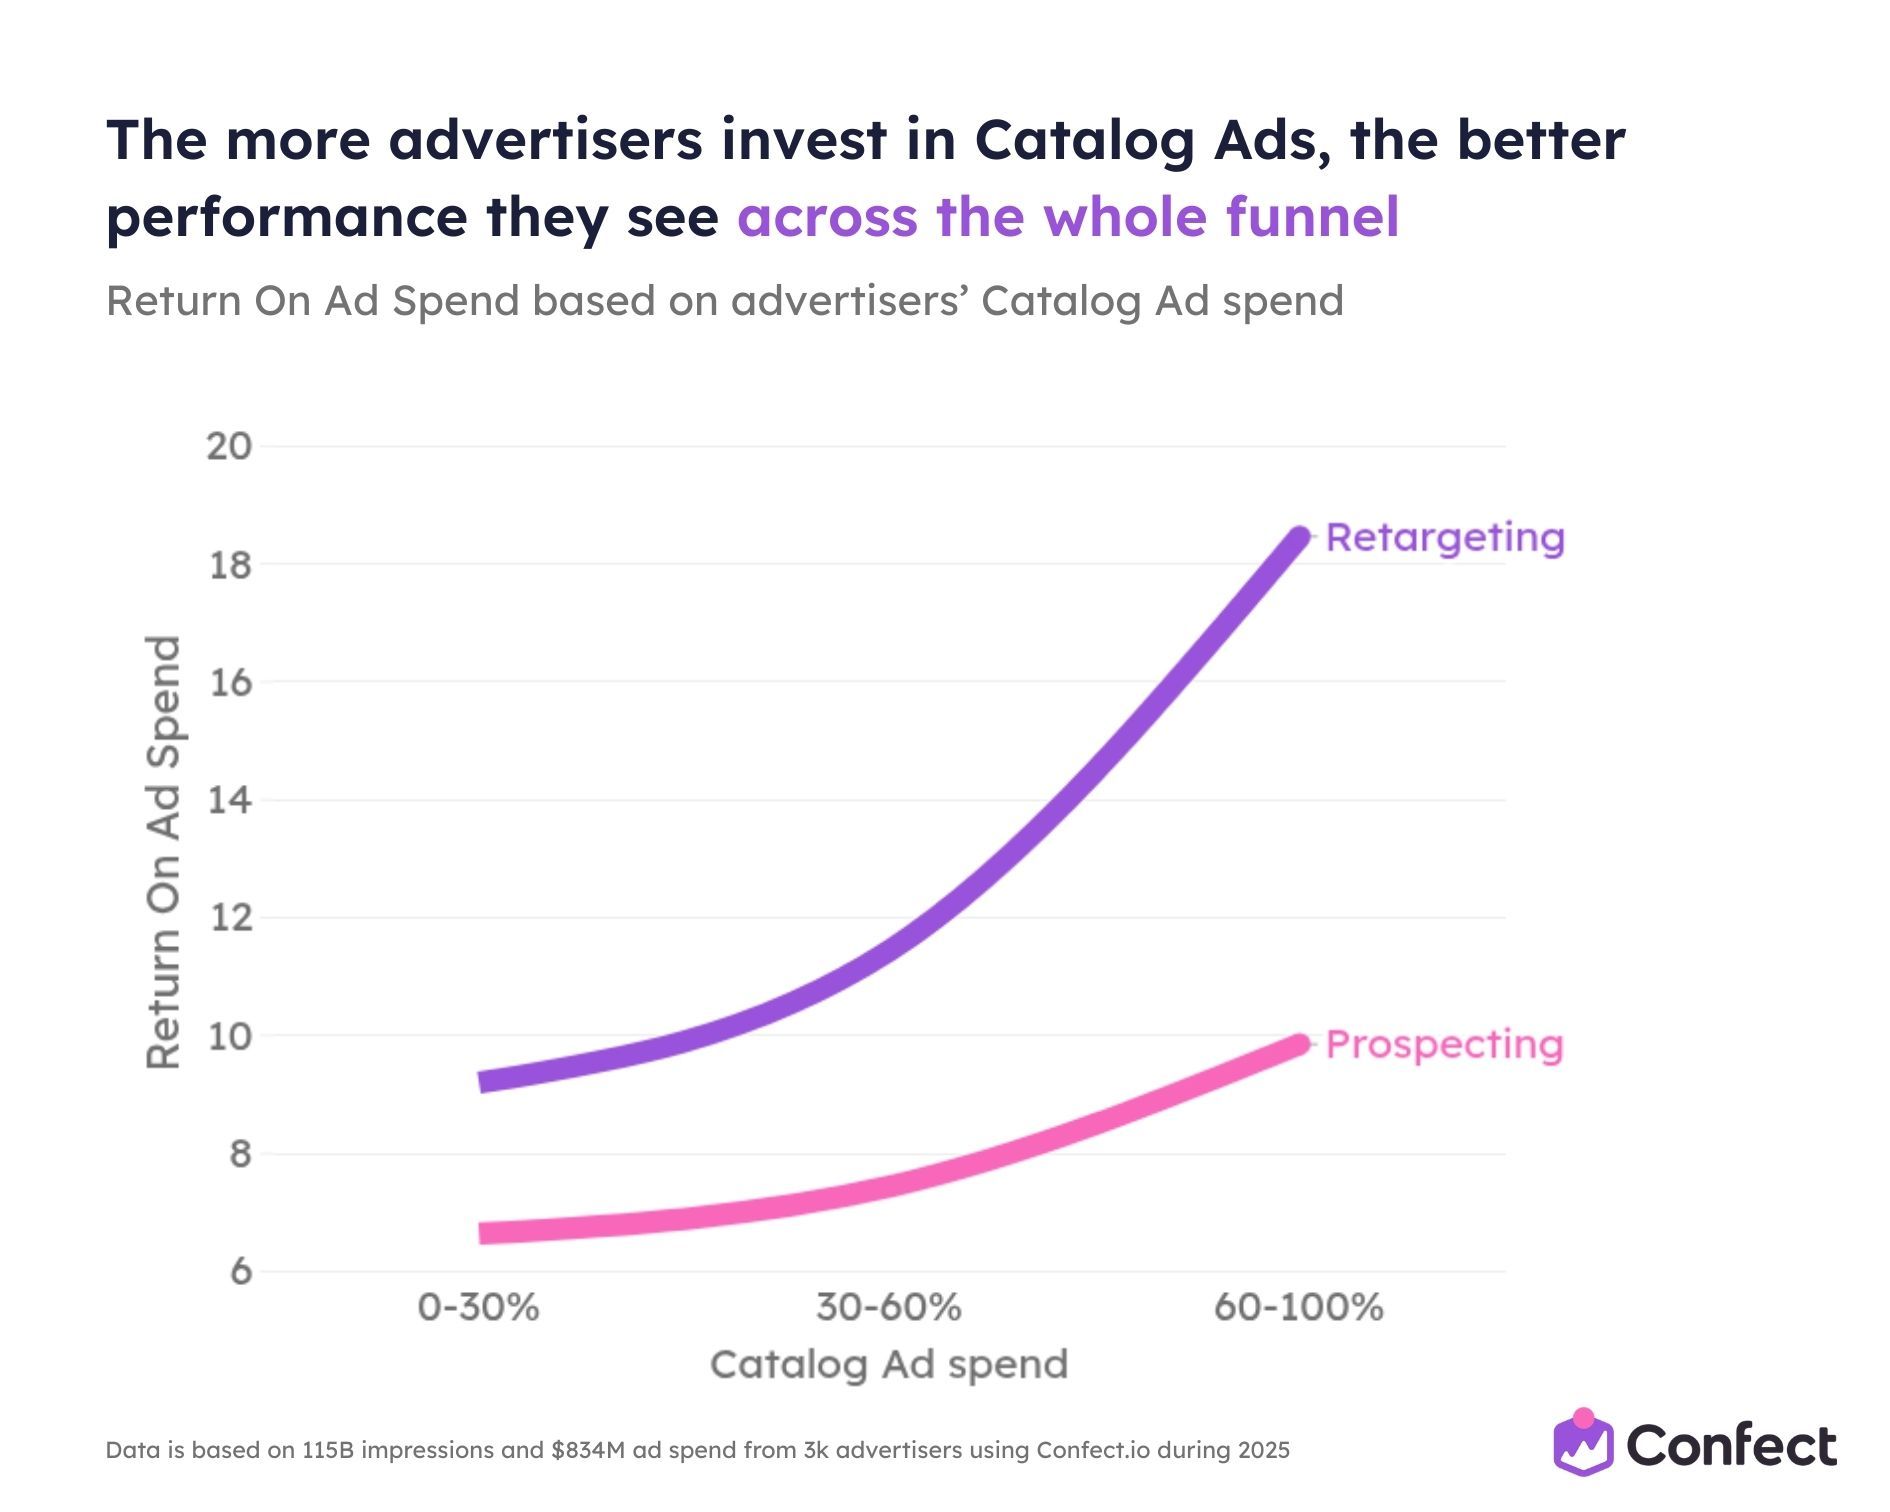
Increasing Catalog Ad spend improves performance across the entire funnel:
- Retargeting ROAS climbs from approximately 9.5 at low catalog spend to roughly 12 at mid, then surges to nearly 19 at high catalog spend. That’s close to doubling.
- Prospecting ROAS rises steadily from approximately 6.8 to 7.5 to 10 - a 47% improvement that makes prospecting Catalog Ads perform better than most advertisers’ total account average.
Think of Catalog Ad investment as a full-funnel flywheel. More prospecting catalog spend creates larger retargeting pools. Catalog Ads then convert those retargeting audiences at exponentially higher rates. The combined full-funnel return is far greater than either stage alone.
The retargeting curve is exponential, not linear. The gains accelerate as you move from 30–60% catalog spend to 60–100%. This suggests a compounding effect that rewards the most committed catalog advertisers disproportionately.
The lifecycle advantage: 20–30% higher ROAS from week zero to week six
The final piece: Catalog Ads don’t just outperform at launch. They maintain their advantage over the entire ad lifecycle.
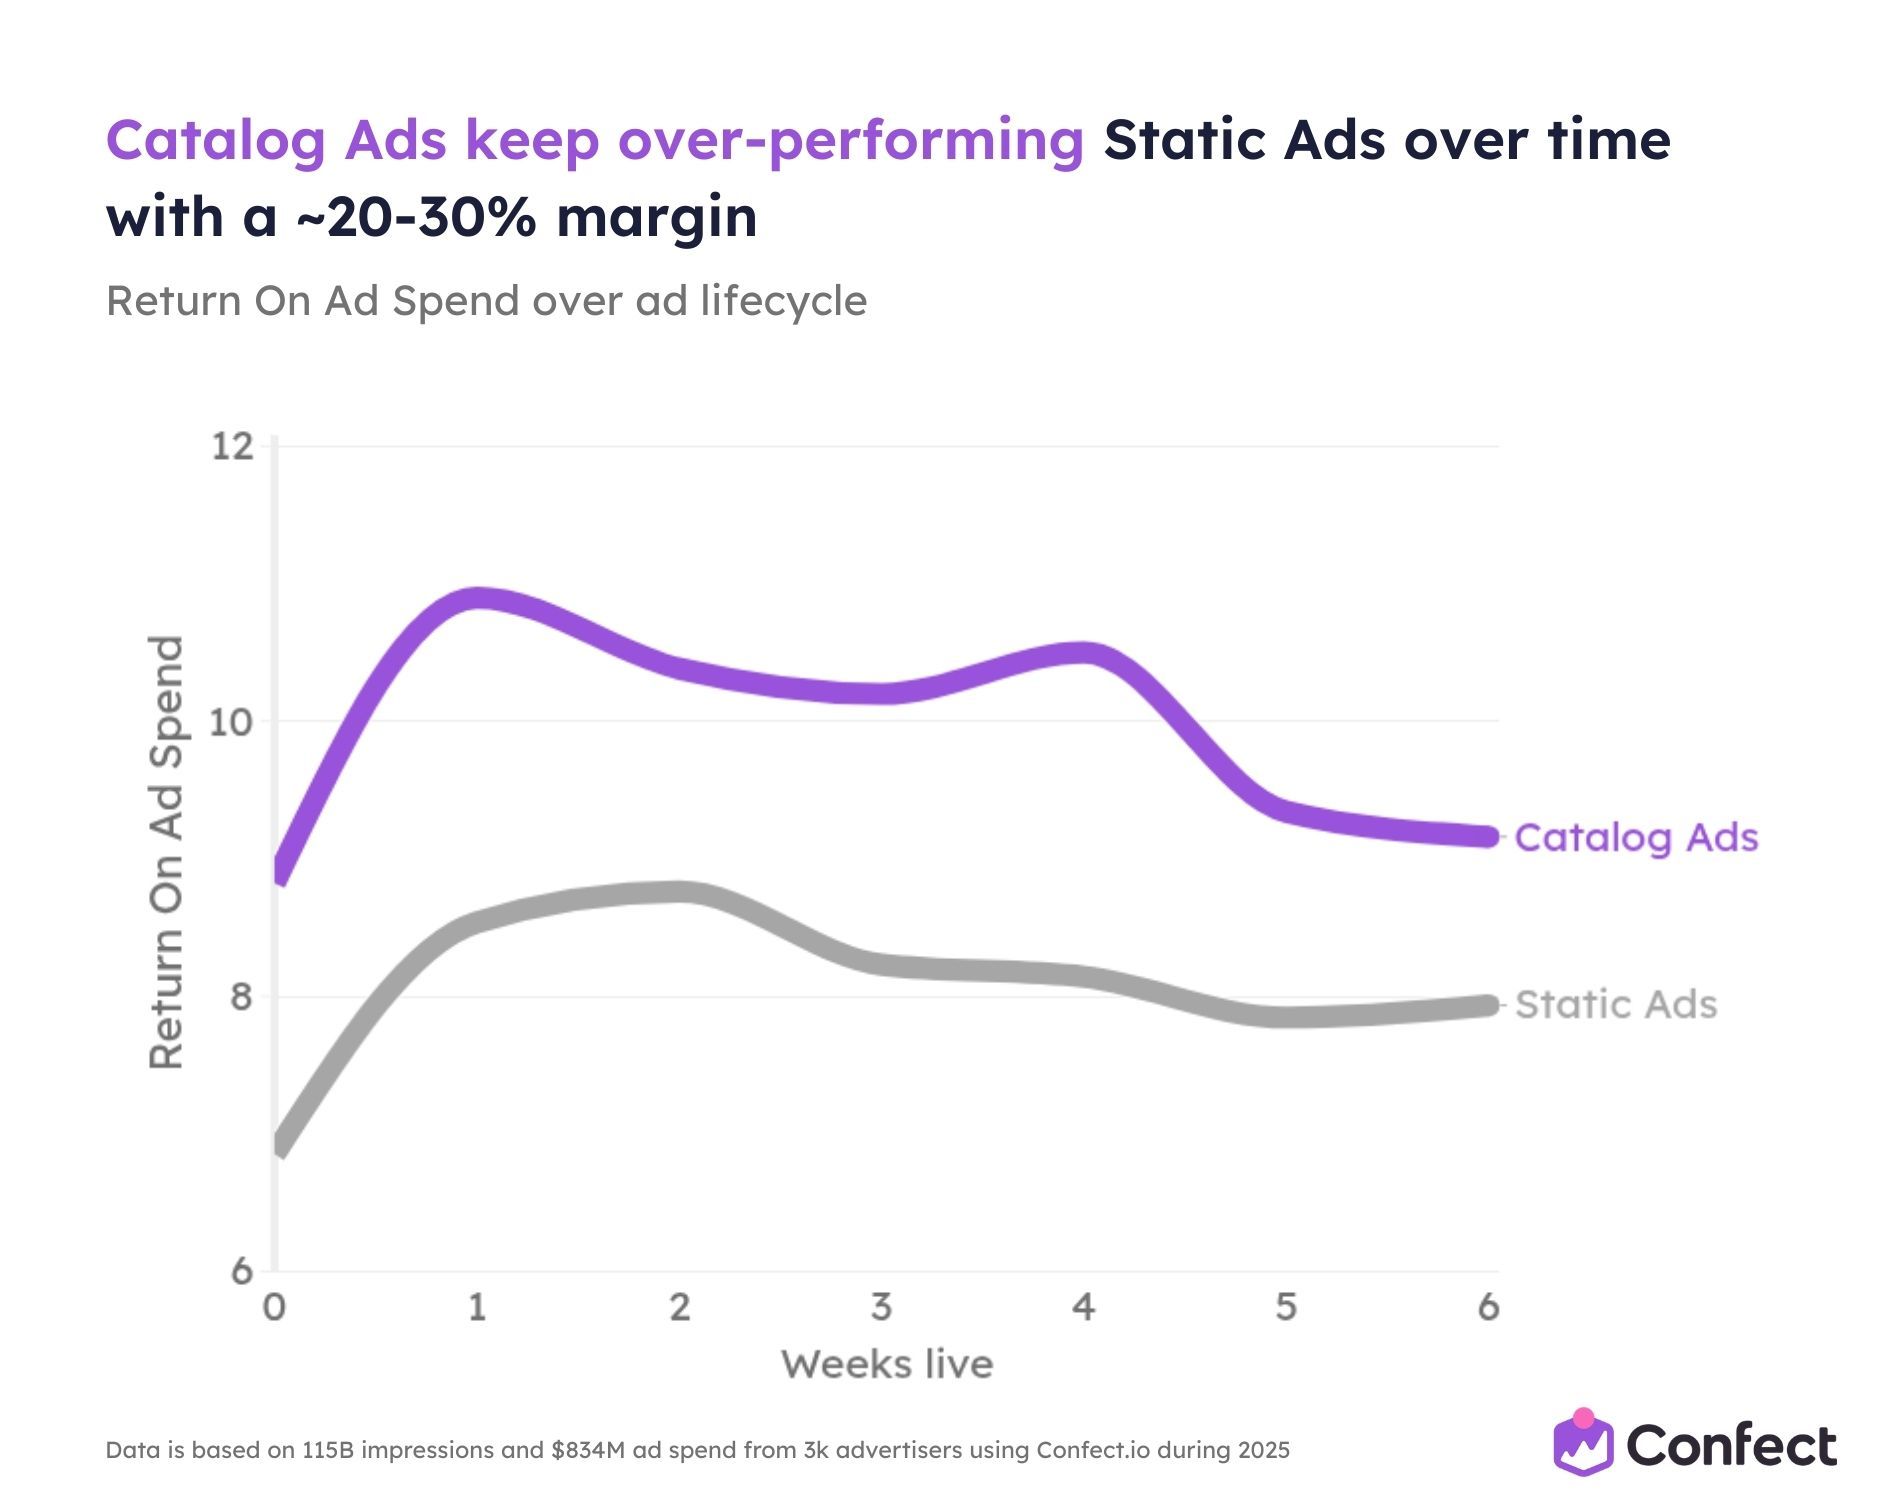
Catalog Ads maintain a consistent 20–30% ROAS advantage over Static Ads across every week from launch through week six and beyond.
Catalog Ads start at approximately 9 ROAS in week zero, peak at roughly 11 in week one, then gradually settle to about 9.5 by week six. Static Ads follow a parallel but lower trajectory starting around 7.0, peaking at roughly 8.8 in week two, and declining to about 8 by week six.
The gap never narrows or closes. Not at any point in the lifecycle.
This happens because Catalog Ads have a built-in fatigue resistance mechanism. Even as a Catalog Ad ages, the product feed behind it continues rotating different products to different users. A Static Ad is one creative that fatigues as a unit. A Catalog Ad backed by hundreds of products maintains freshness at the product level.
The practical implication: set different refresh schedules. Static ads should rotate every 2–3 weeks. Catalog Ads can run longer at 4–6 weeks before needing design template refreshes. Don’t pause a well-performing Catalog Ad at 2 weeks just because your static ads need rotation - the data shows catalogs maintain strong performance through week 4 and beyond.
The pattern is unmistakable
Across every dimension we measured - ad volume, Catalog Ad volume, spend allocation, revenue share, performance metrics, industry, advertiser size, funnel position, and ad lifecycle - the same pattern emerges.
Top performers have built their entire Meta advertising operation around Catalog Ads. They run more of them, spend more on them, earn more from them, and use them across both prospecting and retargeting.
The gap between top and bottom performers isn’t one or two tactical choices. It’s a systematic orientation toward the ad format that Andromeda’s retrieval engine rewards most.
But running more Catalog Ads is just the foundation. The most sophisticated advertisers go further, using five specific advanced tactics that amplify their Catalog Ad performance even more.
That’s what we’ll cover next.
Five Advanced Catalog Ad Tactics of Top Performers
Running more Catalog Ads and spending more on them is the foundation. But the most sophisticated advertisers in this study go further, using five specific advanced techniques that amplify their Catalog Ad performance even more.
Each of these tactics shows a measurable adoption gap between top and bottom performers. The gaps range from 38% to 103%. And each one comes with real-world case studies proving the impact isn’t theoretical.
Here’s the full picture of what top performers are doing that everyone else isn’t:
- Design Rules: +103%
- Multiple formats: +75%
- Video Catalog Ads: +62%
- Product Assets: +56%
- 5+ Creative Variants: +38%
Let’s look at each one.
Running 5+ creative variants (+38% adoption gap)
Top performers are 38% more likely to use 5 or more creative variants for their Catalog Ads.
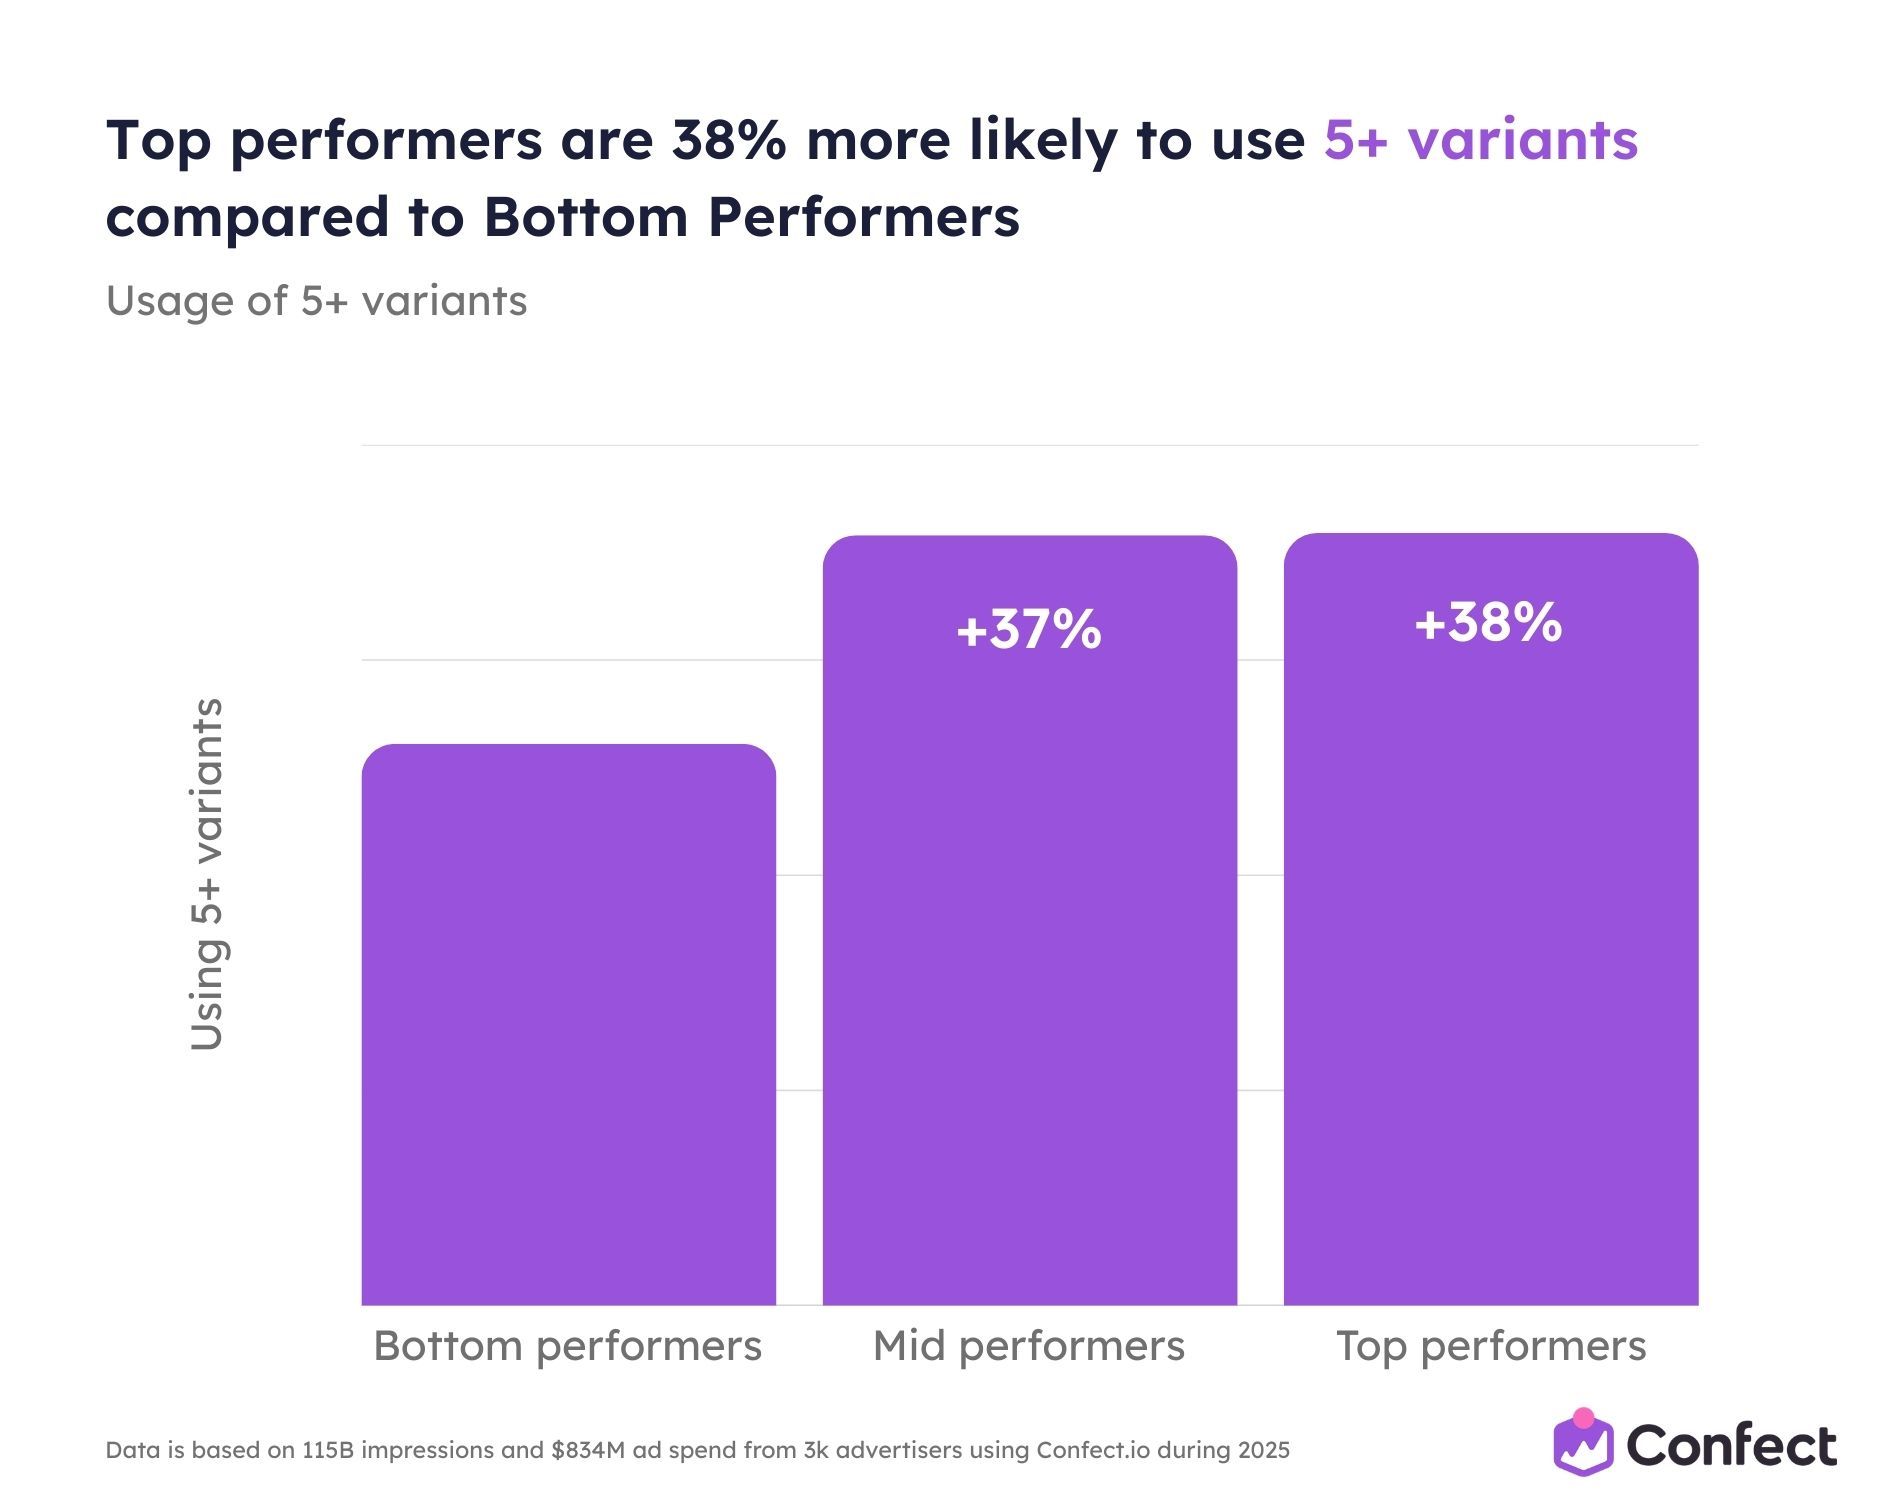
This is not about minor tweaks to the same design. Five or more variants means running genuinely different visual approaches for the same product catalog: a price-focused layout, a lifestyle overlay, a social proof design, a minimal product-only template, and a seasonal campaign version.
Why does this matter so much for Andromeda? Because entity clustering treats visually similar Catalog Ad designs as a single creative entity. If you run one design template across your entire catalog, you get one retrieval ticket. Five distinct templates give you five.
Different visual approaches also appeal to different psychological motivators. A price-focused design attracts deal seekers. A lifestyle overlay attracts aspirational buyers. A social proof design attracts risk-averse shoppers. Each variant unlocks a separate audience segment that the others can’t reach.
The adoption gap between bottom and mid performers (+37%) is nearly identical to the gap between bottom and top (+38%), suggesting there’s a threshold effect: once you cross the 5-variant mark, the benefit is immediate.
Case study: Vero Moda got a +60% increase in sales
Vero Moda, one of the biggest women’s fashion brands in the world, achieved a 60% increase in sales and a 46% increase in traffic by running multiple distinct Catalog Ad variants simultaneously.
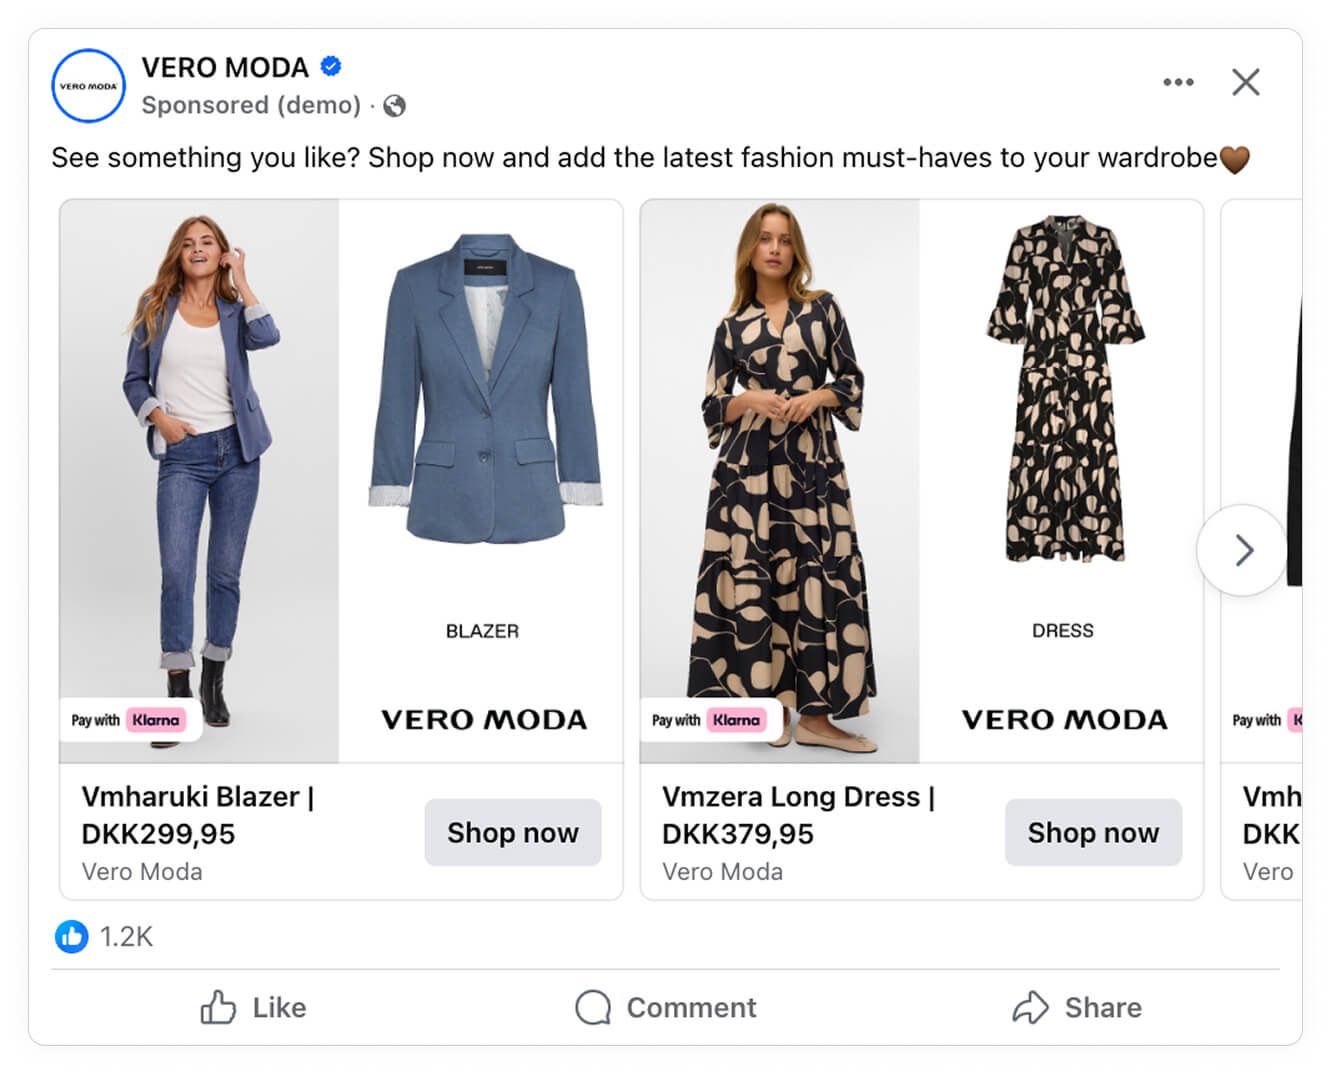
Their approach wasn’t random. They systematically tested different hypotheses, starting with the most impactful changes first:
- First testing different types of product imagery (model shots vs. packshots vs. combinations)
- Then testing which product information to include (price vs. no price, category labels vs. product names)
- Then testing smaller elements (payment methods, styling details)
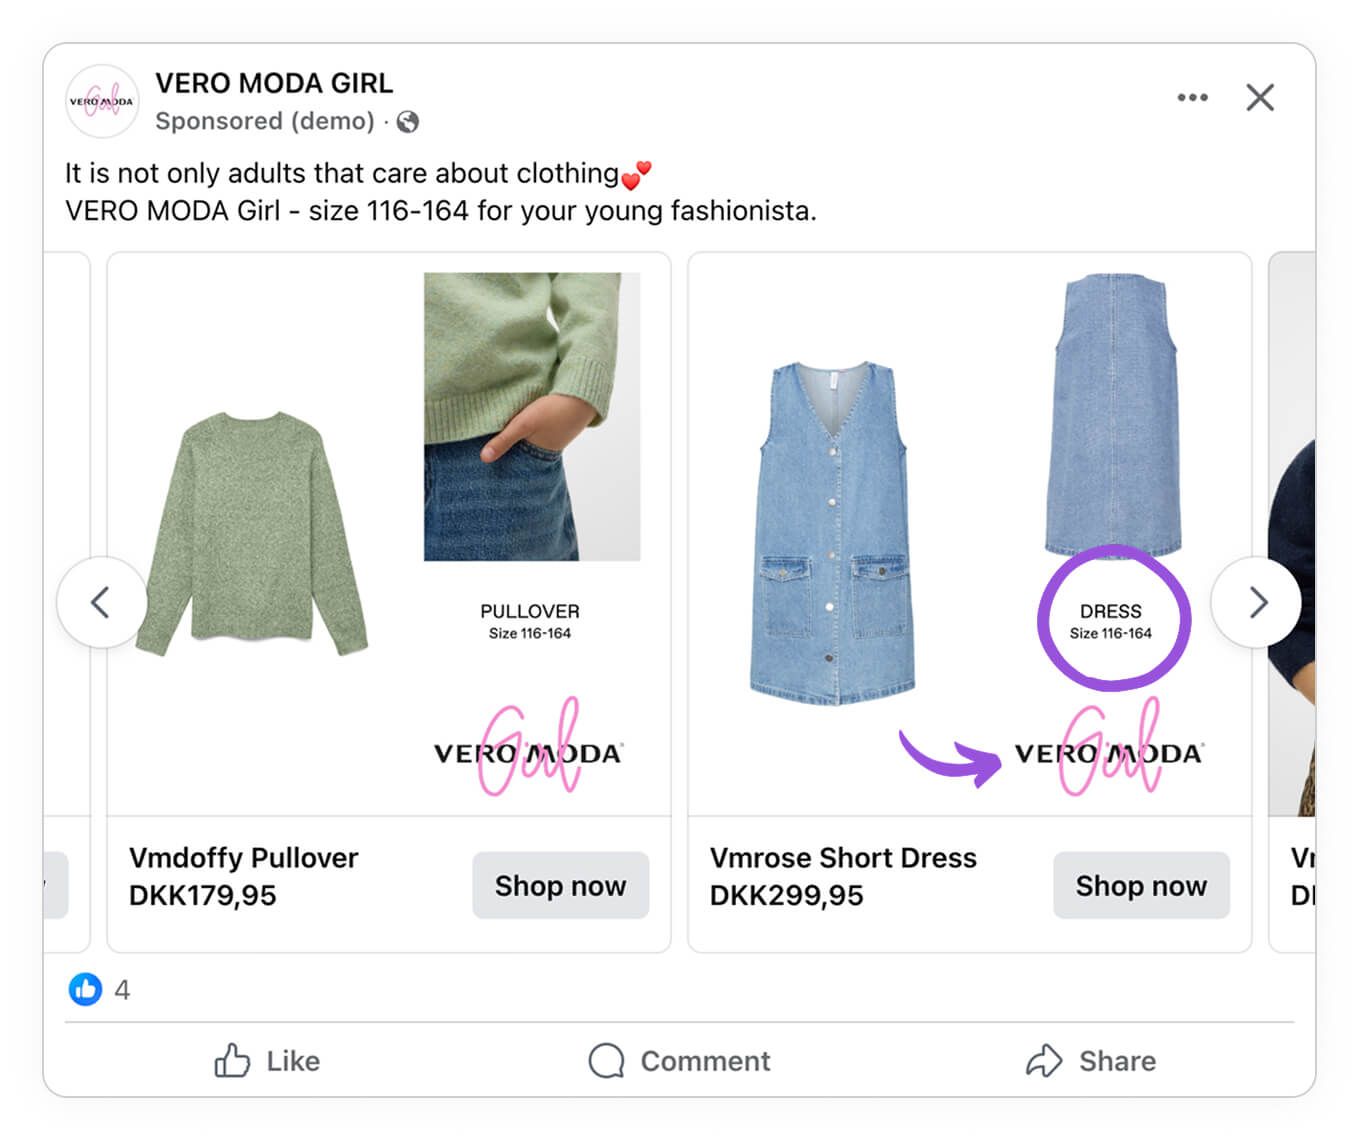
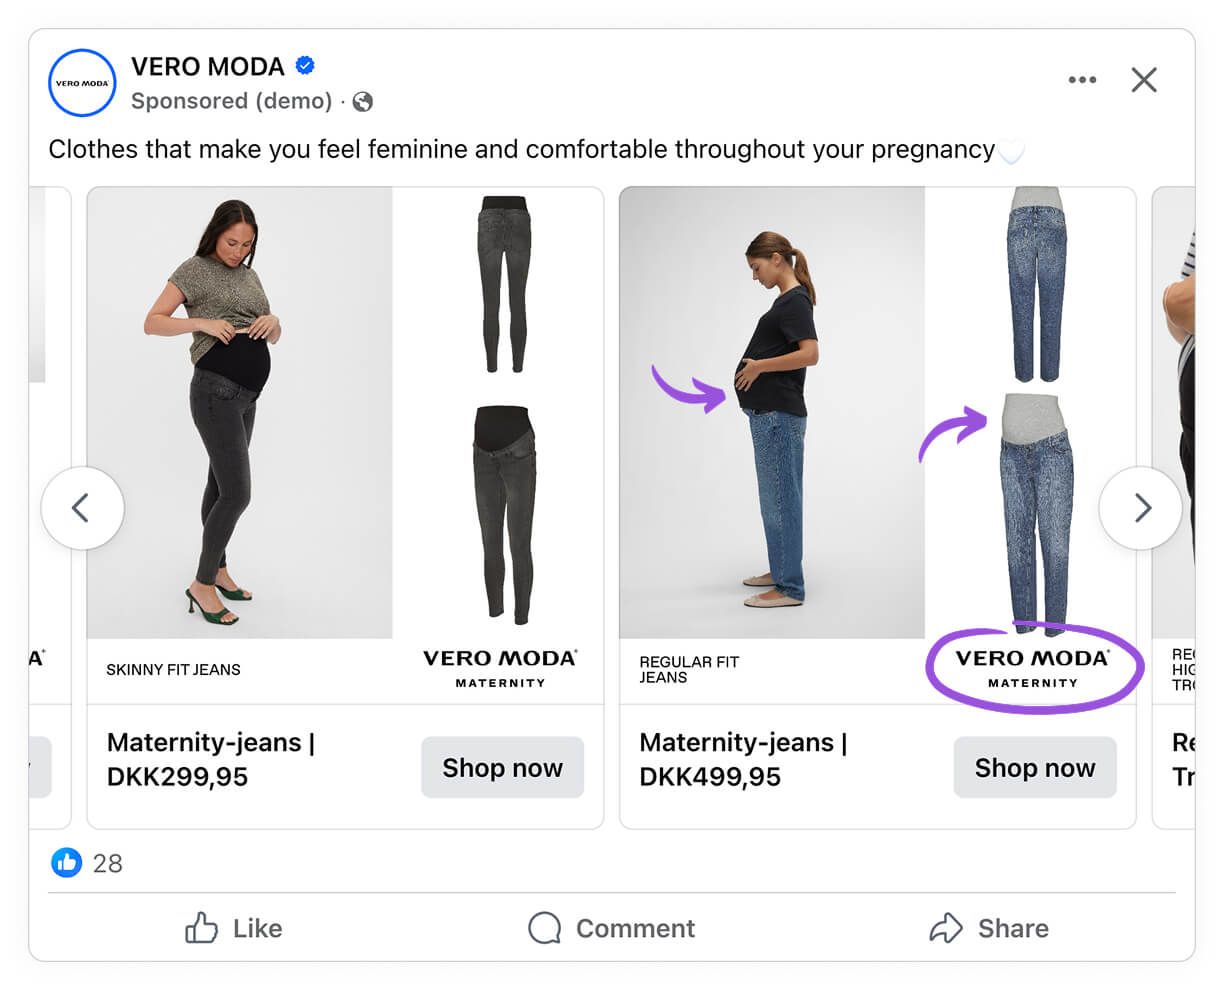
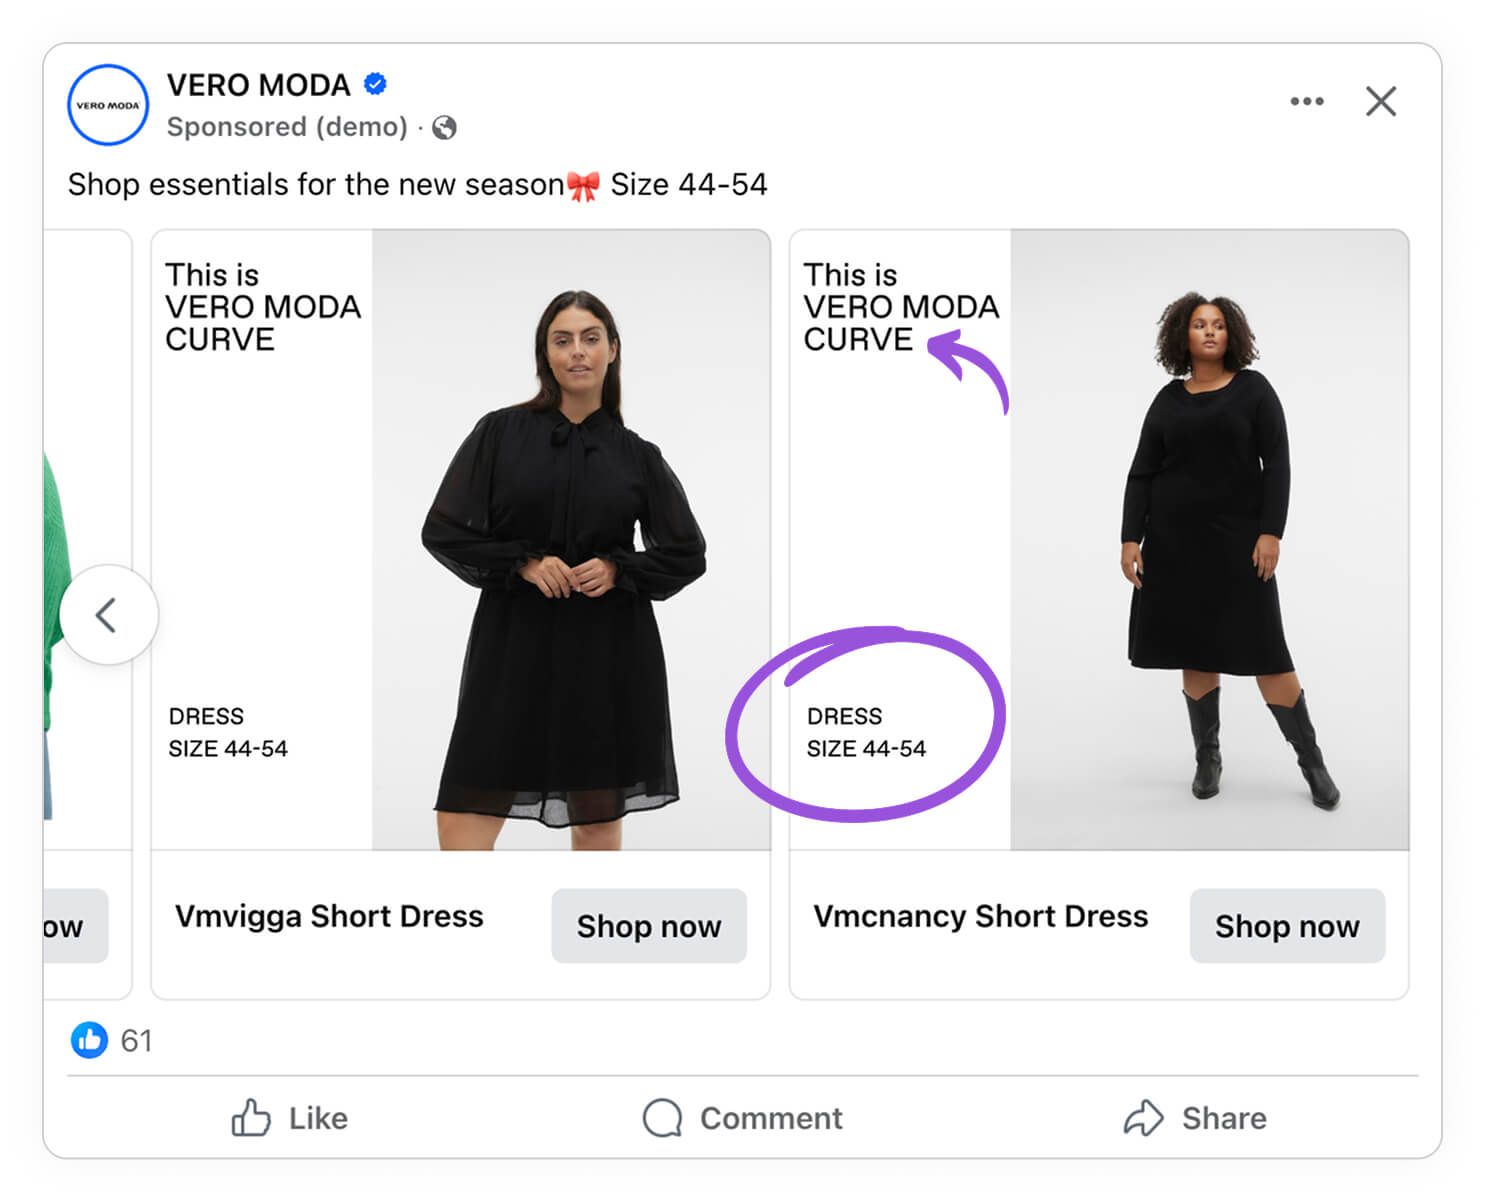
Their best-performing variant combined a model image with a packshot, giving shoppers both a styled view and a detail view of the product. They also created audience-specific variants for sub-brands: Vero Moda Girl (highlighting age range 6–16), Vero Moda Curve (displaying size range 44–54), and Vero Moda Maternity (featuring adjustable waistbands and stretch fabrics).
Each sub-brand variant included tailored messaging that spoke directly to that specific customer segment.
The takeaway: different audiences need different information. Variants let you deliver that personalization at scale.
Read the full case study here.
Case study: Bed Kingdom & Connective3 achieved a 58% lower CPA
Bed Kingdom, working with agency Connective3, improved CPA by 58% when running multiple Catalog Ad variants simultaneously - proving the approach works beyond fashion, in the home and furniture category.
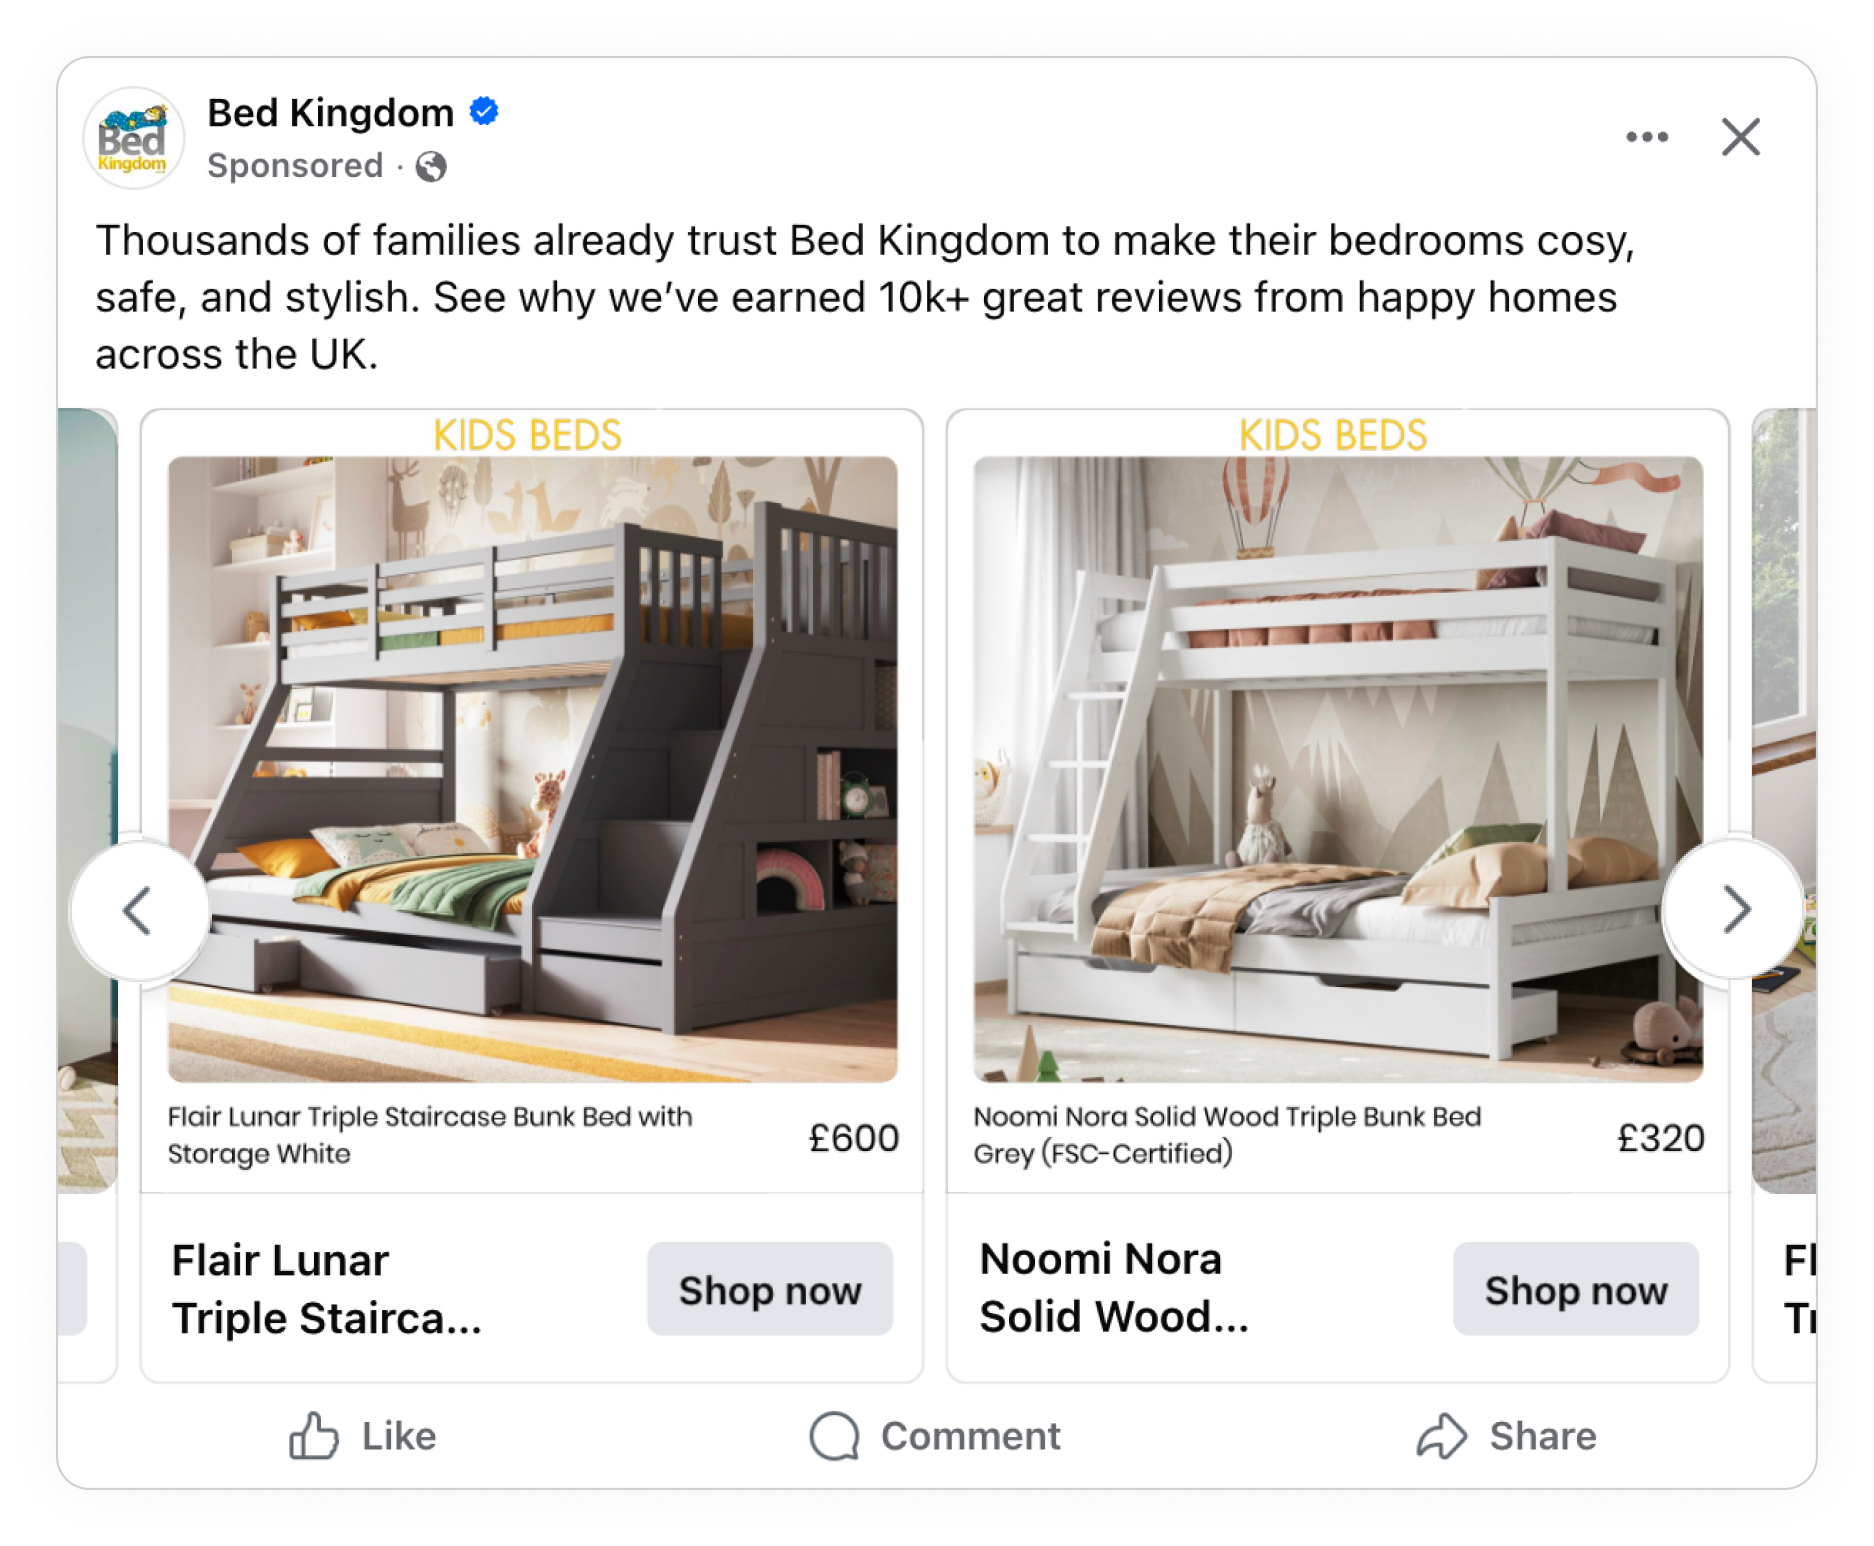
Read the full case study here.
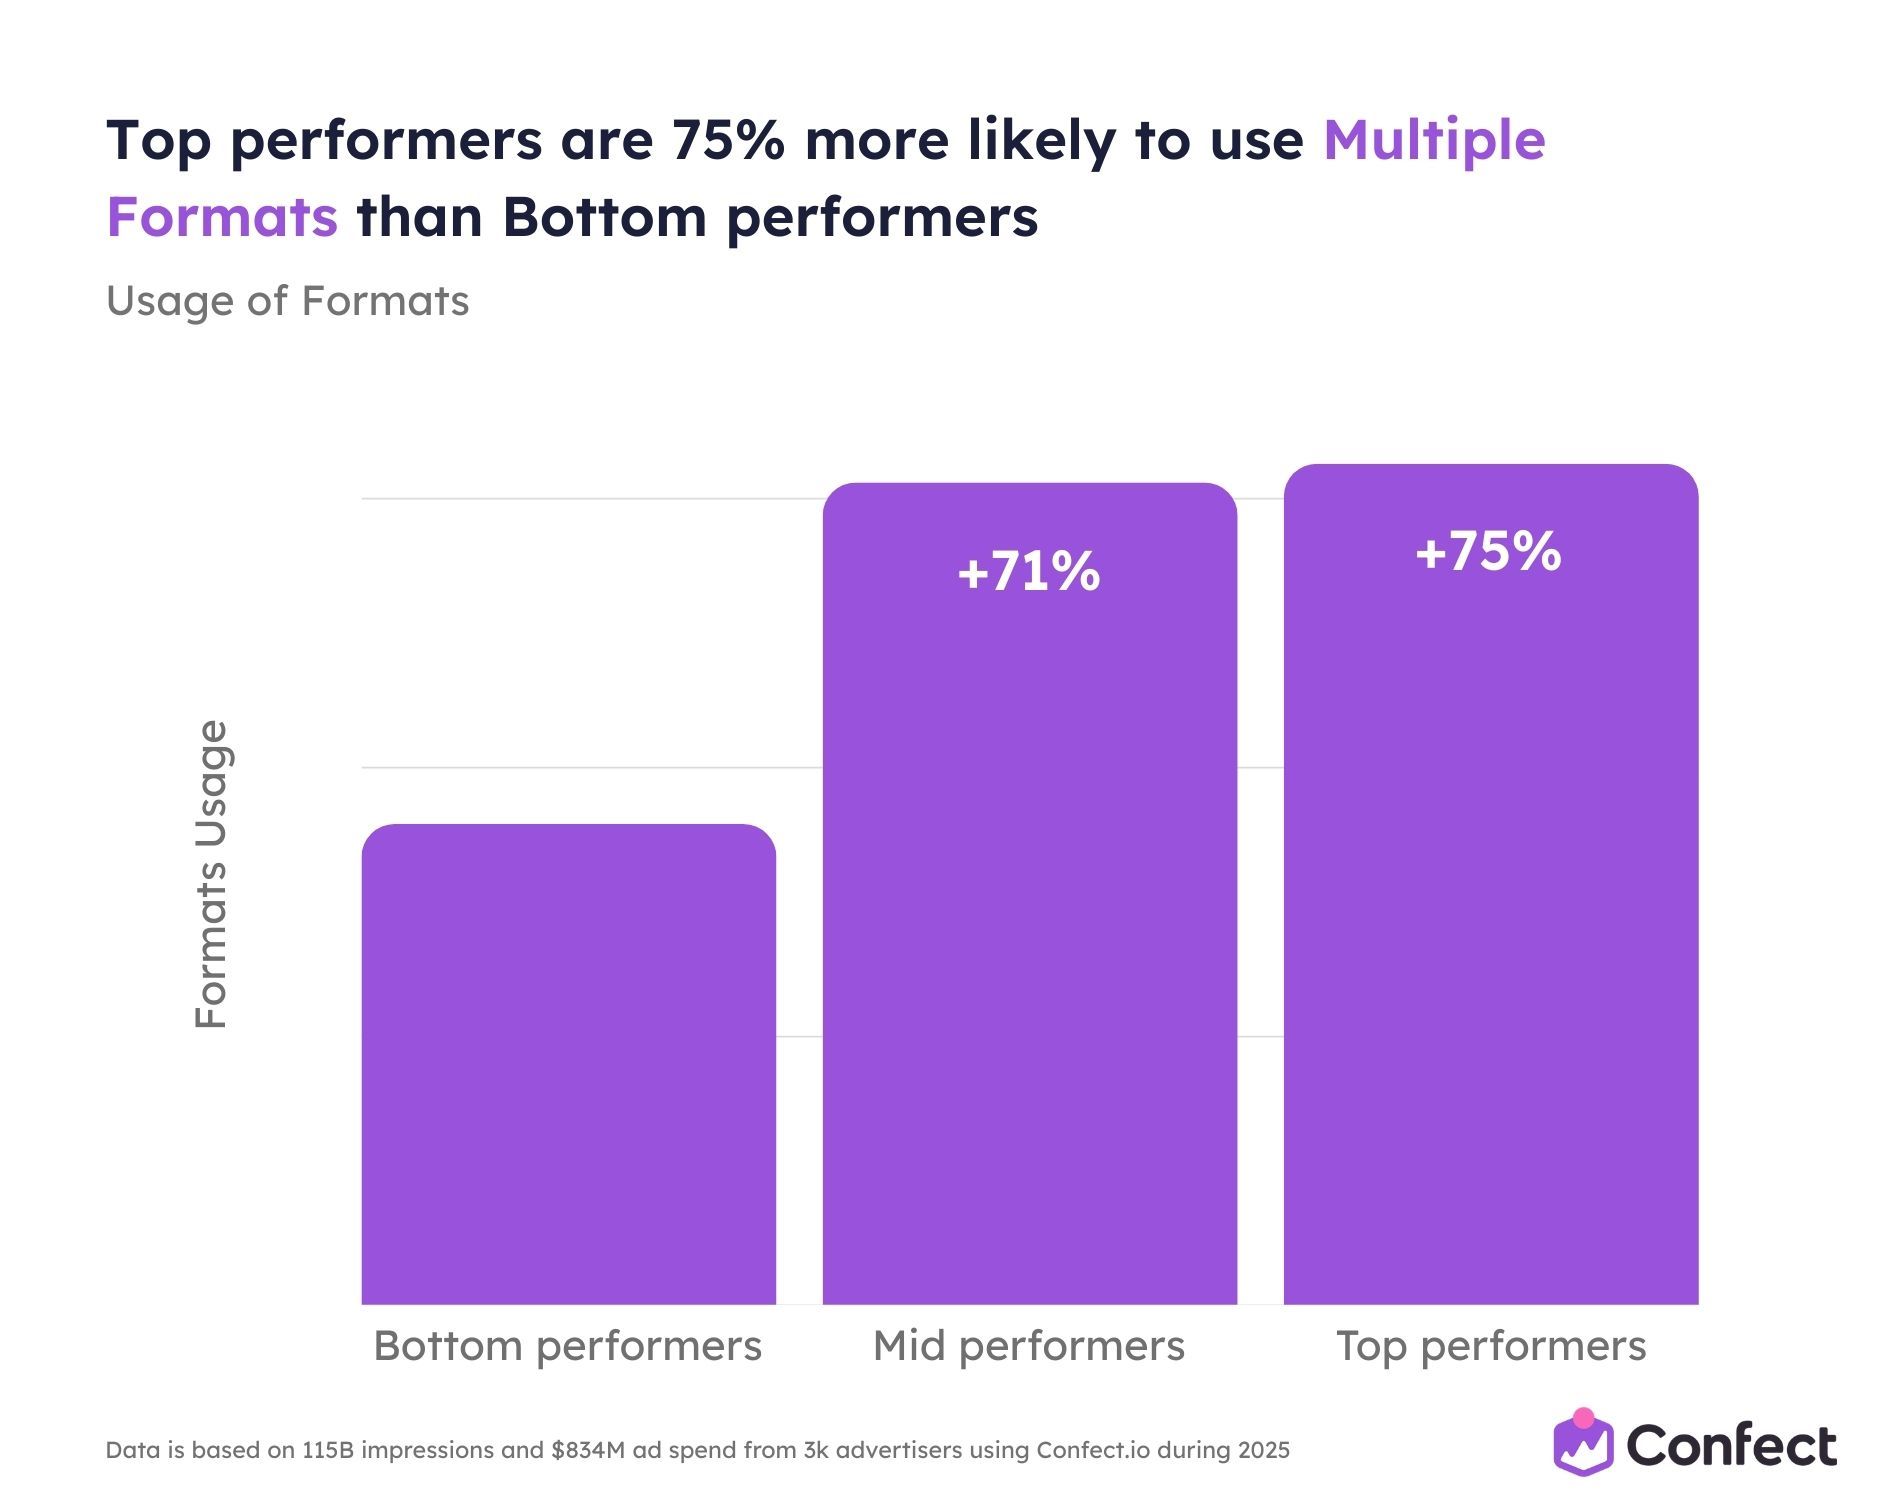
Using multiple placement formats (+75% adoption gap)
Top performers are 75% more likely to use multiple ad formats than bottom performers, the second largest adoption gap in this section.
Using multiple formats means creating Catalog Ad designs optimized for different aspect ratios and placements: 1:1 for Feed, 4:5 for mobile Feed, and 9:16 for Stories and Reels. Instead of uploading one square image and letting Meta crop it awkwardly for vertical placements, you give the algorithm a natively designed creative for each surface.
This matters for two reasons.
First, a single 1:1 square creative forced into a 9:16 Stories placement gets cropped or letterboxed. It looks bad, reduces engagement, and Andromeda’s ranking system interprets that weaker performance as a lower-quality creative signal - deprioritizing your ad.
Second, multiple formats effectively multiply your entity count. A product shown in 1:1 Feed format, 4:5 mobile format, and 9:16 Stories format registers as three distinct visual entities in Andromeda’s retrieval system, tripling your retrieval opportunities from a single product.
Bottom performers typically upload one format and rely on Meta’s automatic cropping. That’s leaving performance on the table.
Case study: SOFACOMPANY got a +85% higher ROAS and a +28% higher AOV
SOFACOMPANY achieved 85% higher ROAS and 28% higher average order value simply by creating placement-adapted formats for their Catalog Ads across 1:1, 4:5, and 9:16 ratios.
.png)
The designs were tailored for each placement, not just resized - ensuring the product was always prominent, the text always readable, and the layout always native to the viewing context.
Read the full case study here.
Case study: LEO LIN & Elephant Room achieved a +82% higher ROAS and a +81% higher CVR
Australian luxury fashion brand LEO LIN, working with agency Elephant Room, achieved 82% higher ROAS and an 81% higher conversion rate when using format-adapted Catalog Ads - proving the impact is consistent across very different product categories and price points.

Read the full case study here.
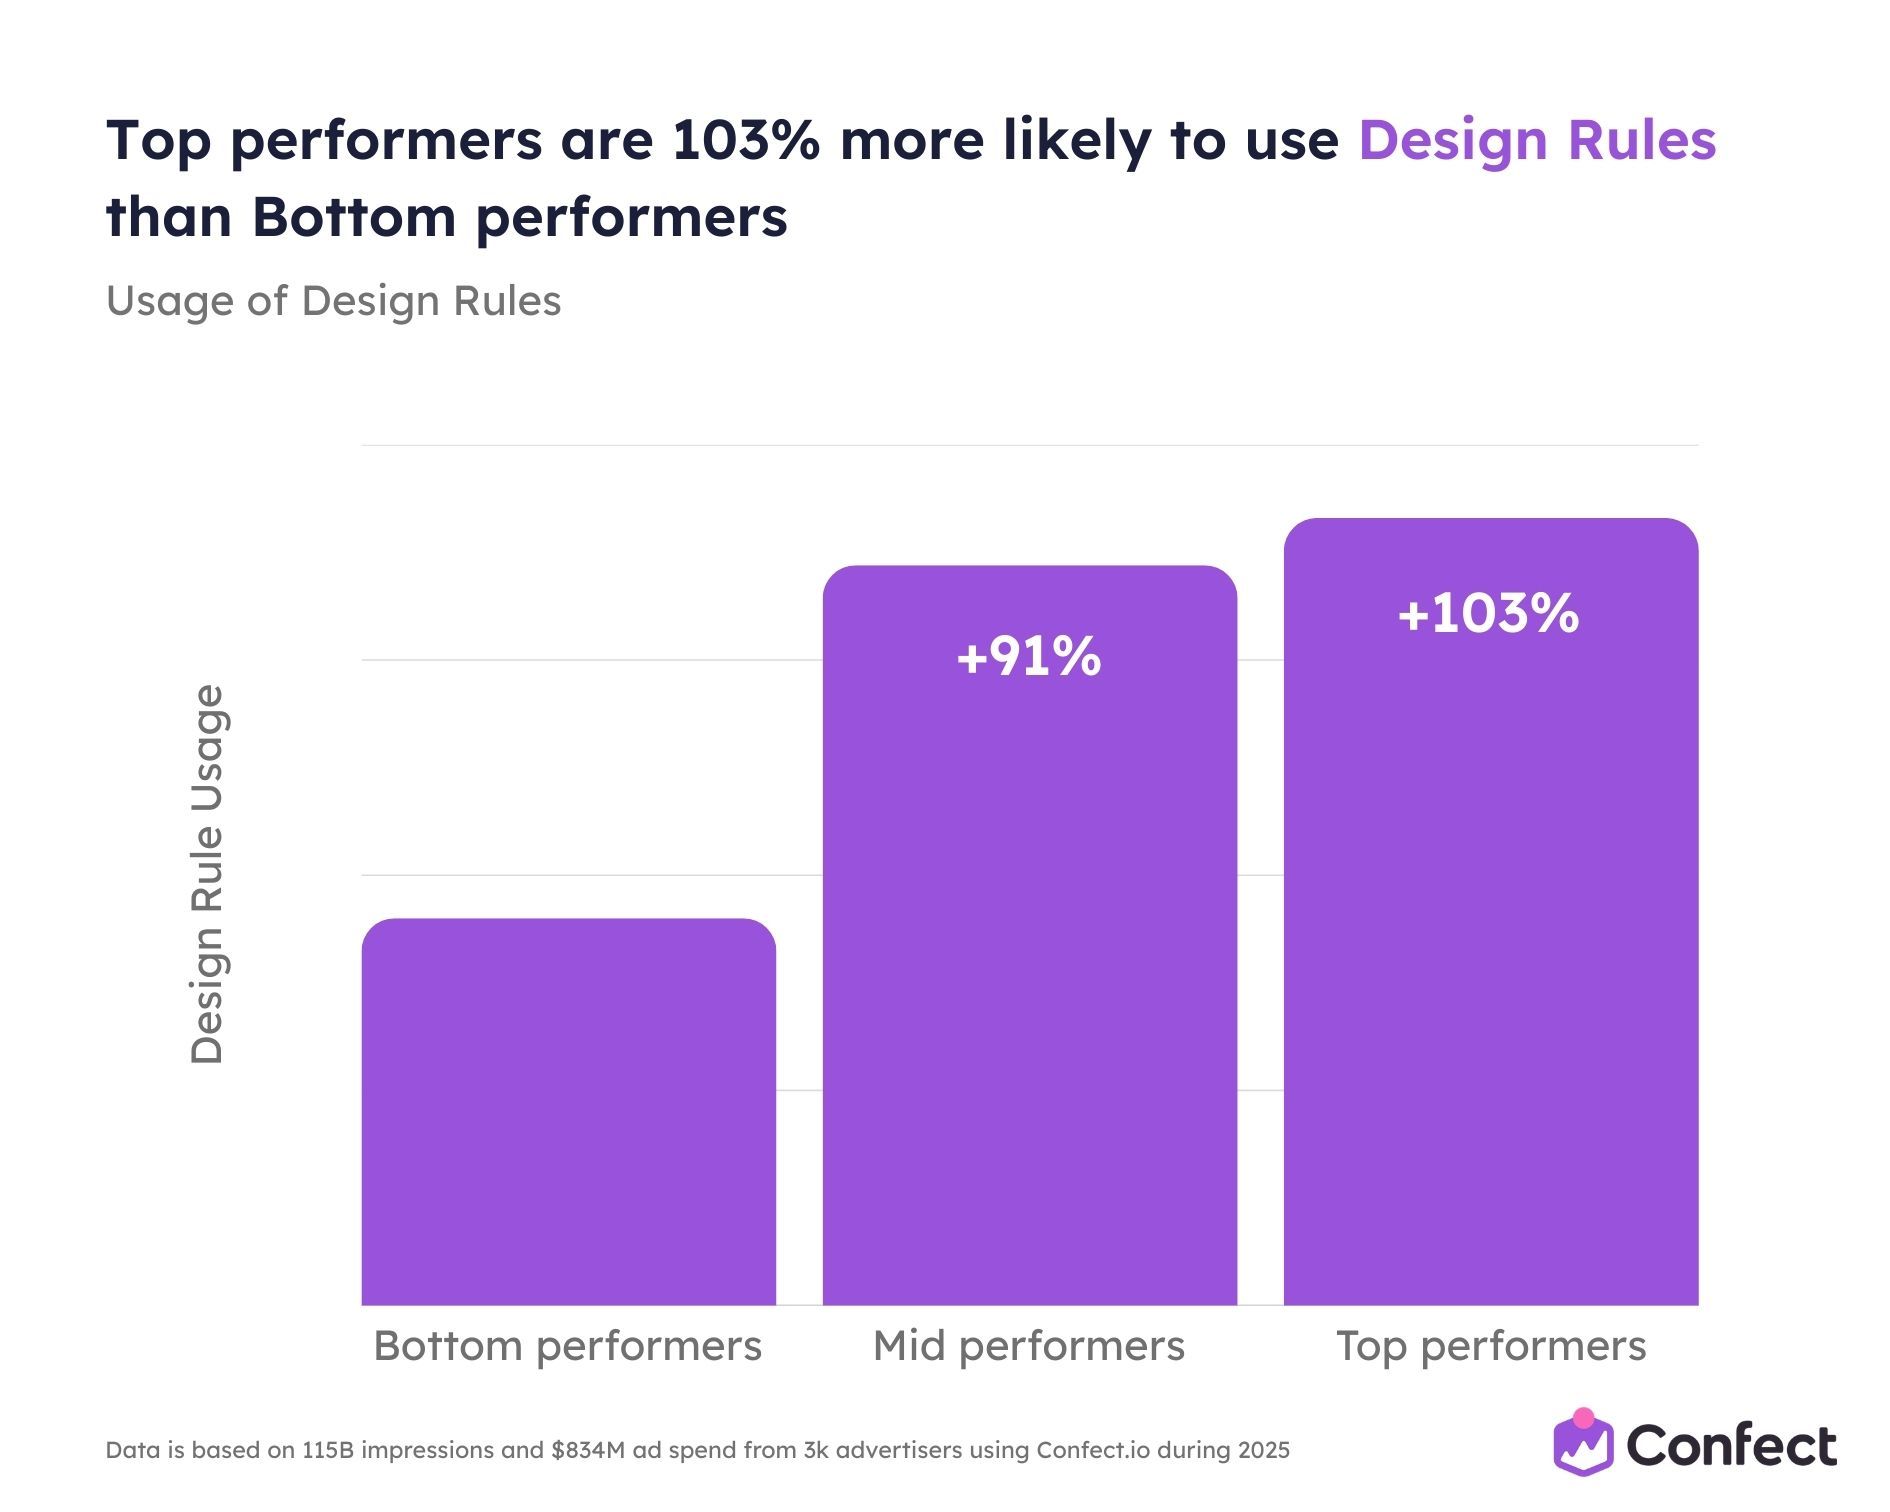
Using Design Rules (+103% adoption gap)
This is the biggest behavioral differentiator between top and bottom performers in the entire study. Top performers are 103% more likely to use Design Rules, more than double the adoption rate of bottom performers.
Design Rules allow advertisers to dynamically change creative elements based on product-level data. A sale badge appears only when a product is actually discounted. A seasonal message activates only during campaign periods. A low-stock urgency signal shows only when inventory is running thin. All of this happens automatically without manually swapping creatives.
This is powerful for Andromeda because each conditional variation creates a genuinely different visual output. A product shown with a sale badge, the same product shown with a seasonal overlay, and the same product shown with a social proof element register as three different visual entities in the retrieval system. One design template with 4 conditional rules can produce dozens of visually distinct outputs depending on product data.
At 103%, this is the largest gap of any advanced feature, far exceeding 5+ variants at 38%, multiple formats at 75%, product assets at 56%, and video catalog ads at 62%.
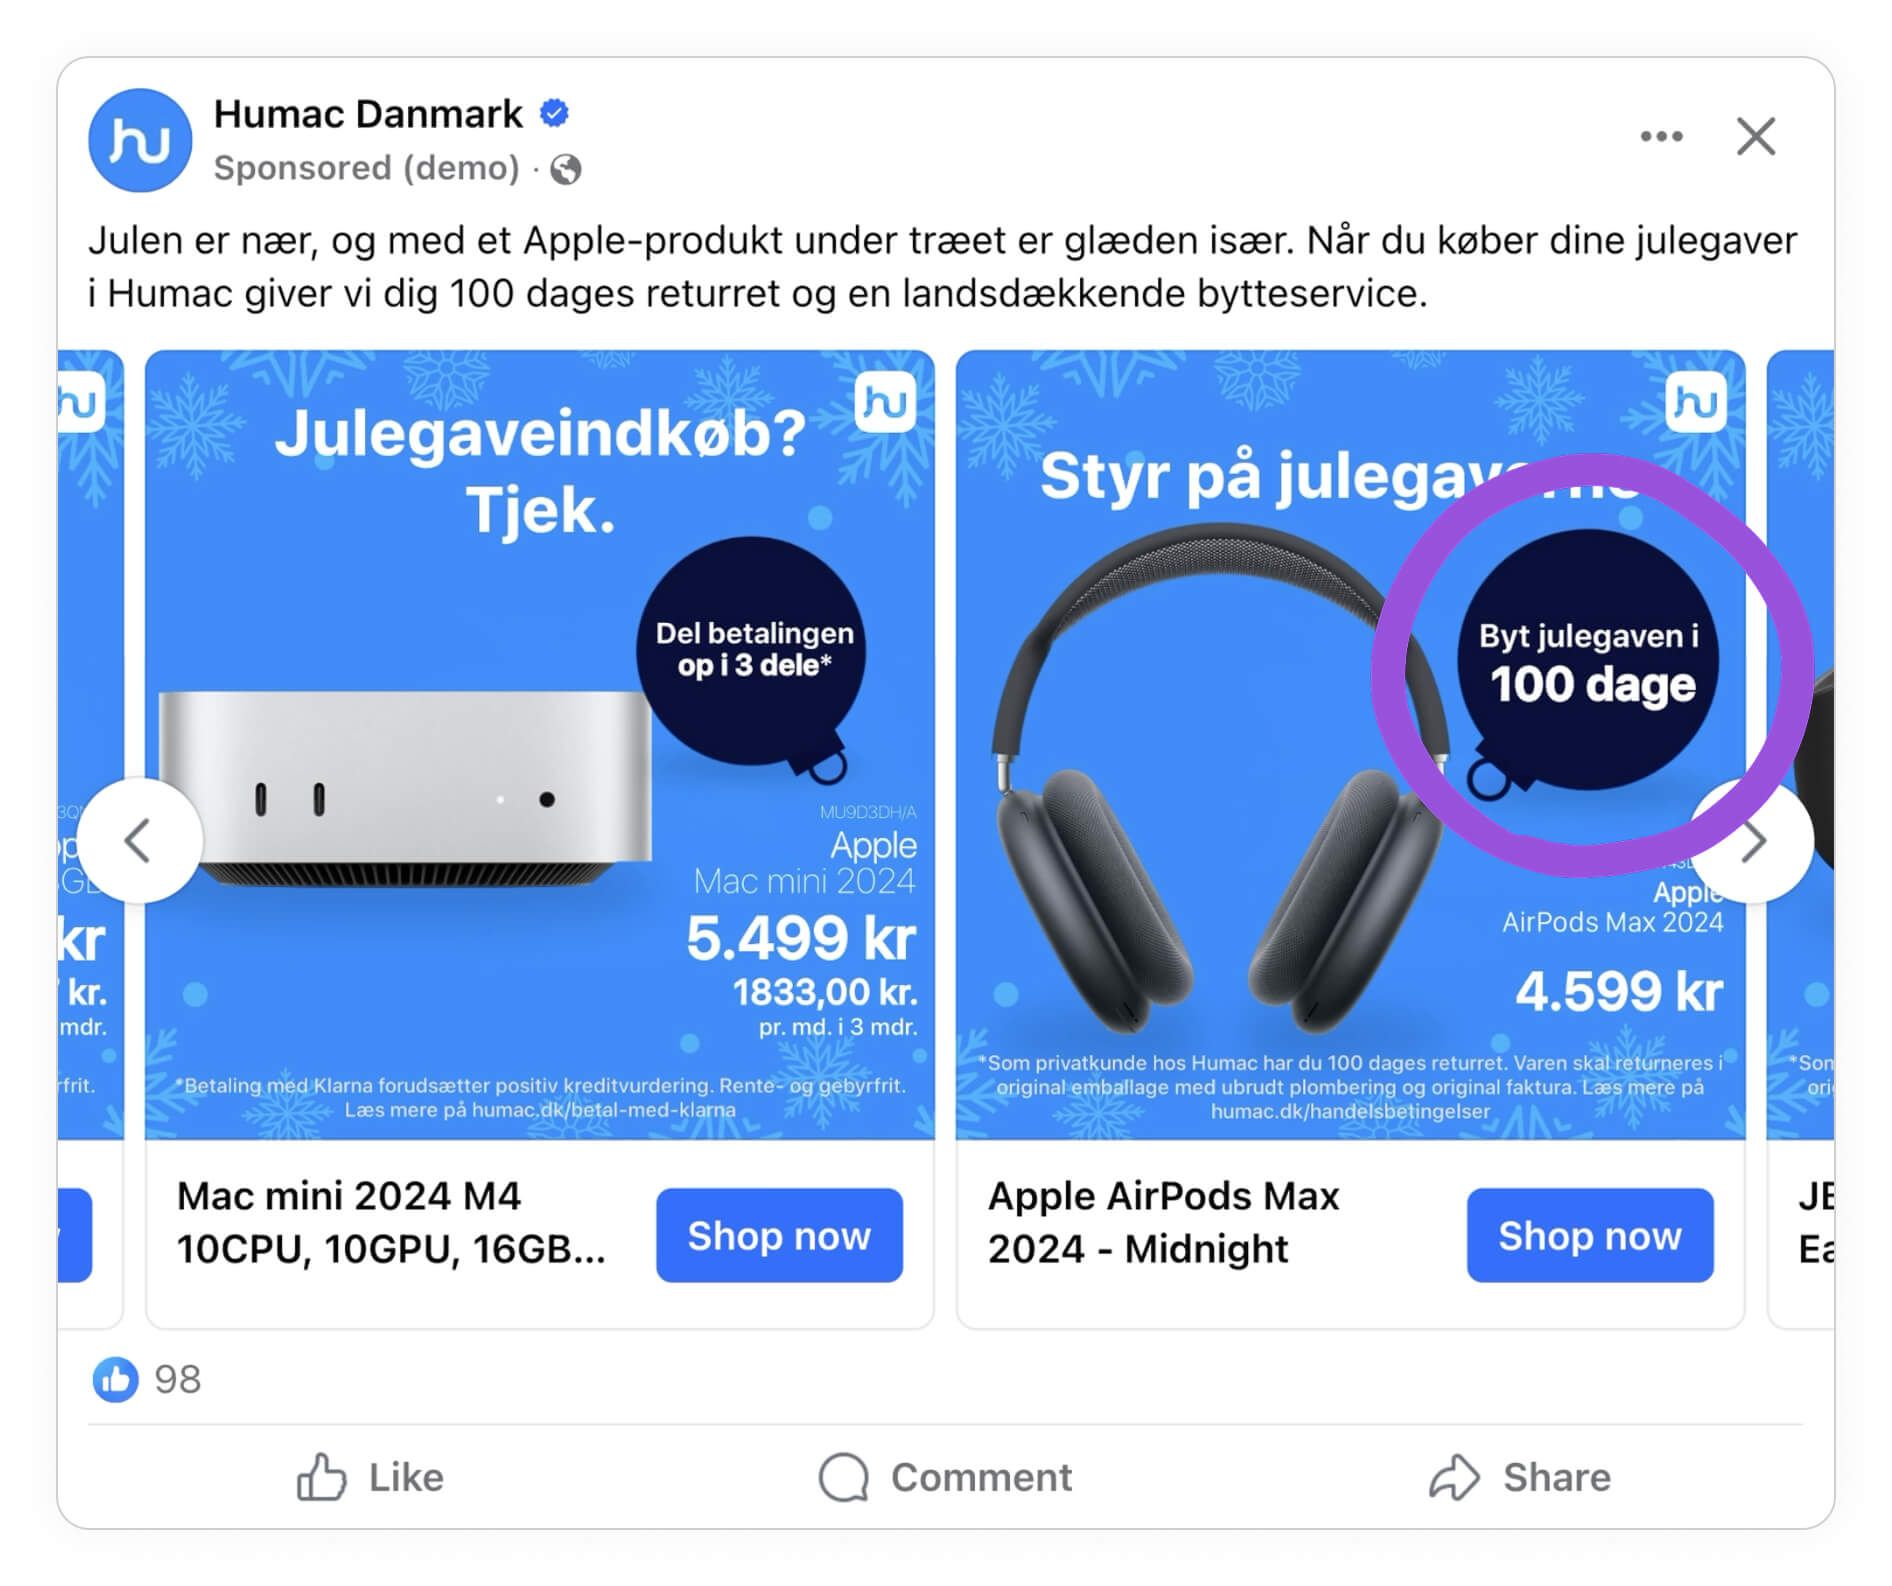
Case study: Humac and their +42% higher conversion rate
Humac, the biggest Apple retailer in Scandinavia, improved conversion rates by 42% and click-through rates by 23% during Christmas using Design Rules to dynamically adapt their Catalog Ads messaging.
Their approach was layered and time-sensitive:
- December 1st: Catalog Ads automatically switched from the always-on design to a Christmas design, highlighting 100-day return rights and Buy Now Pay Later options - removing friction for gift buyers.
- December 18th: The design shifted again to emphasize Click & Collect availability through December 23rd, answering the number one concern of late shoppers: “Will it arrive in time?”
- December 24th: The design automatically reverted to the always-on template.
All of this was set up in advance using Confect’s scheduled design rules. No manual creative swaps. No resetting Meta’s learning phase. The ads adapted automatically to the most relevant message for that moment in time.
They also used product-level rules: for products above their average Buy Now Pay Later order value, the design highlighted monthly payment amounts. For products below that threshold, it emphasized the 100-day return guarantee instead. Different products, different consumer concerns, different messaging, all automatic.
Read the full case study here.
Case study: Charli & Prospa - a +313% increase in new customer purchases
Fashion brand Charli, working with agency Prospa, achieved a 313% increase in new customer purchases by using Design Rules to add contextual messaging like best-selling badges and seasonal collection labels to their Catalog Ads. That’s not a typo, 313%.

Read the full case study here.
Using Product Assets (+56% adoption gap)
Top performers are 56% more likely to use Product Assets in their Catalog Ads.
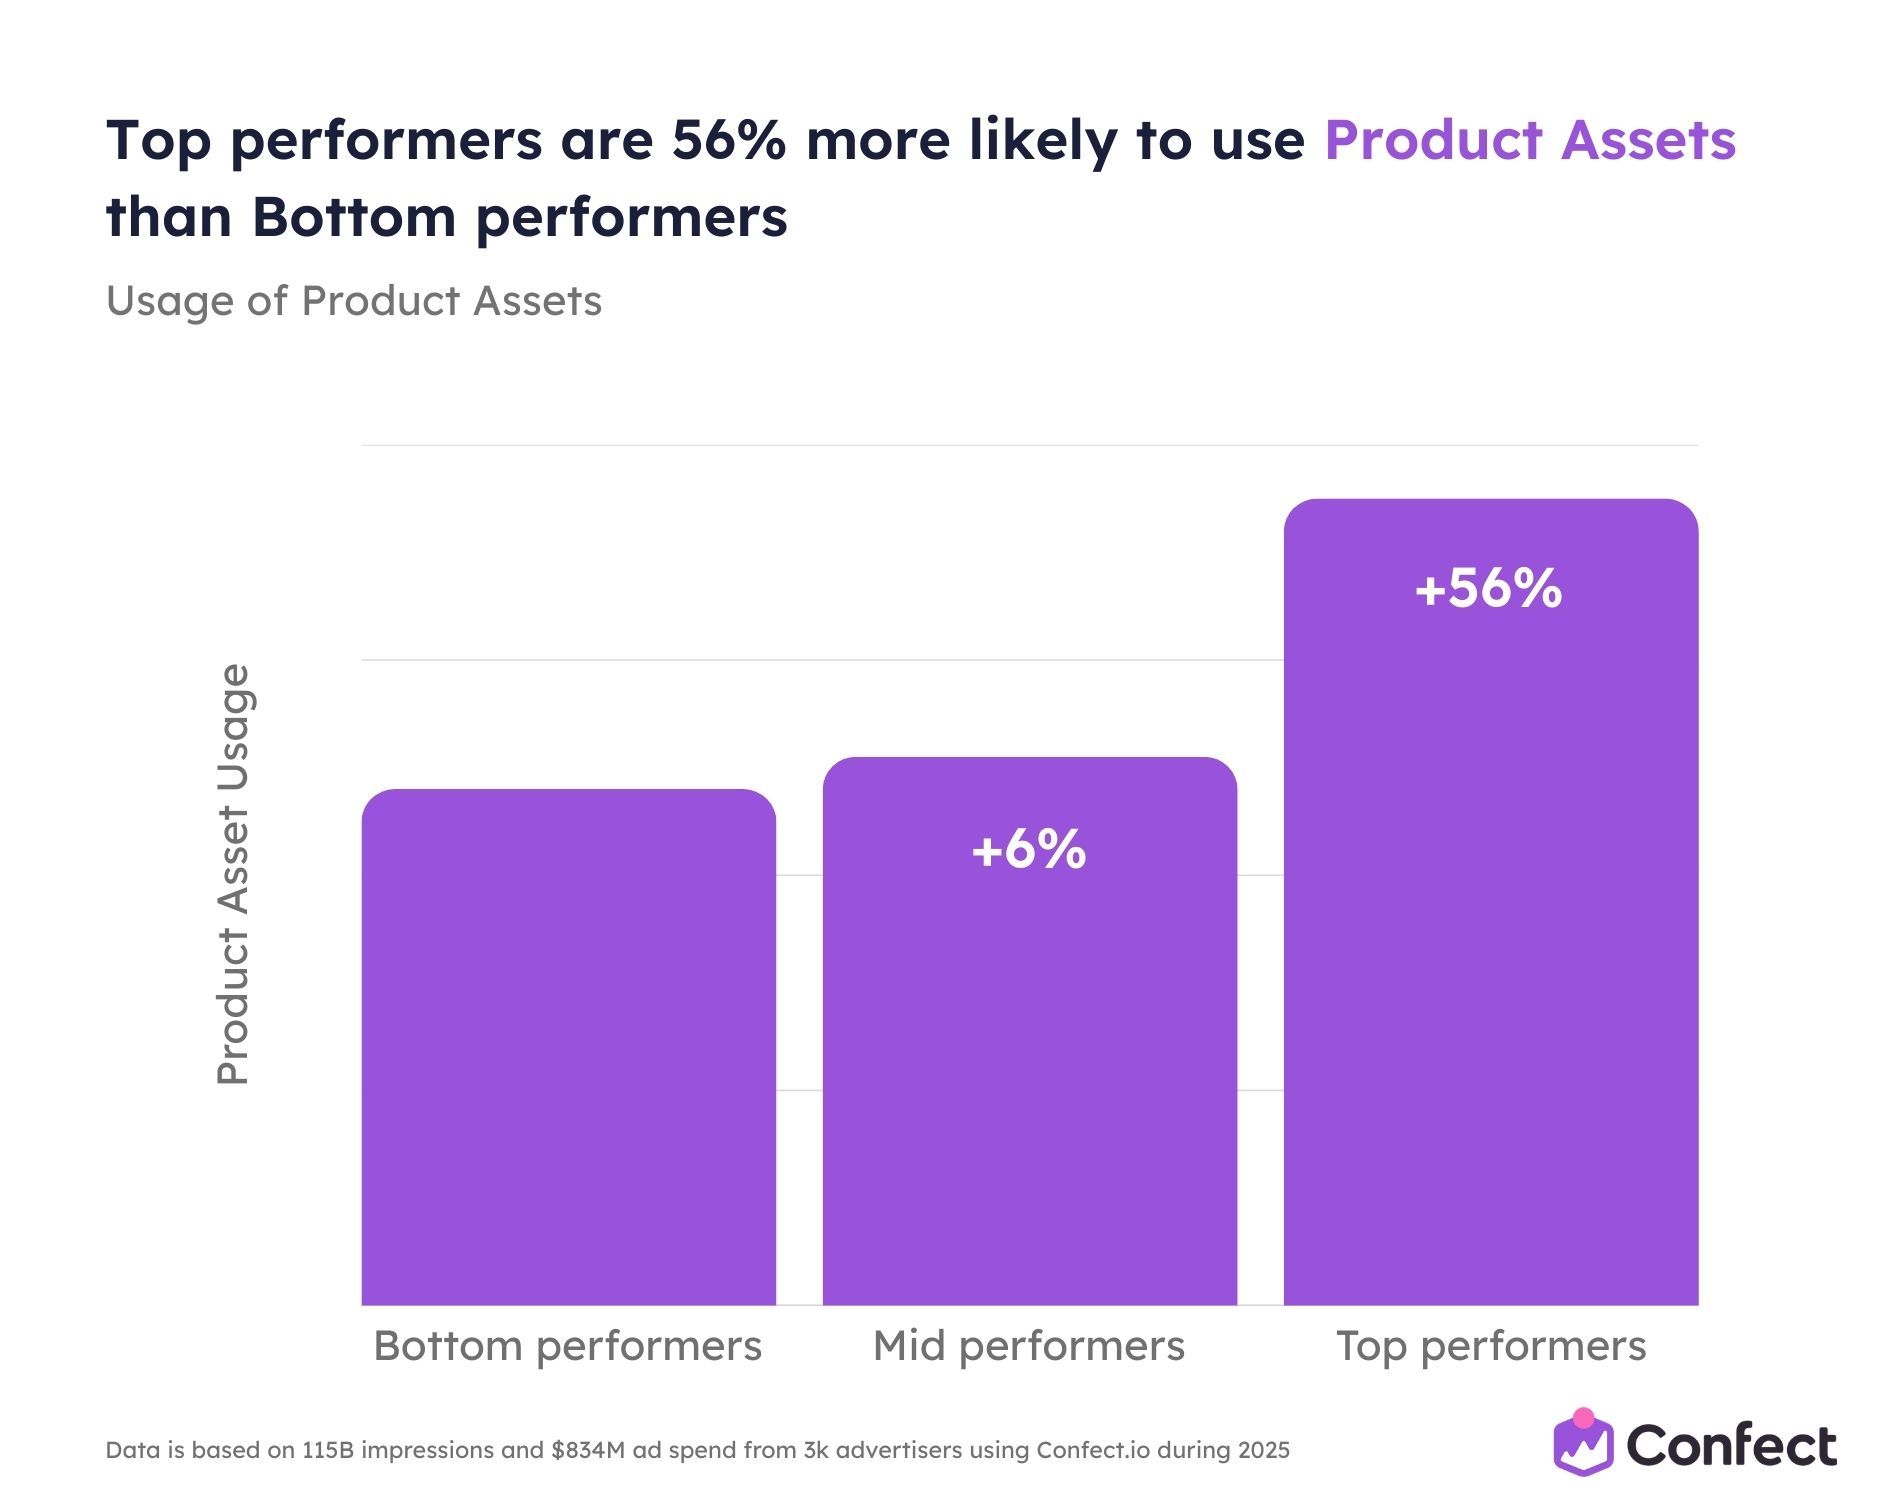
Product Assets are dynamic visual elements pulled from product-level data - brand logos, certification badges, color swatches, lifestyle imagery - that are automatically overlaid onto Catalog Ad creatives, adding rich visual context without manual design work per product.
The adoption pattern here is unique. Mid performers are only 6% ahead of bottom performers, the smallest inter-tier gap of any advanced feature. But top performers leap 56% ahead. This suggests Product Assets are a late-stage optimization that the very best advertisers have discovered, while the broader market hasn’t caught on yet.
That gap is your opportunity. Because most of your competitors haven’t implemented this, there’s a significant first-mover advantage available.
Product Assets add visually distinct elements that Andromeda’s computer vision can detect. A product shown with a brand logo registers as a different visual entity than the same product without one. Brand logos and certification badges also act as instant trust signals for cold audiences who don’t yet know your store but recognize the product brand - directly addressing the conversion rate challenge from Andromeda’s broader traffic.
Case study: HiFi Klubben made a +48% increase in ROAS
HiFi Klubben, a premium electronics retailer, achieved a 48% increase in ROAS by dynamically displaying manufacturer brand logos like Denon and NAD on their Catalog Ads.

For a multi-brand retailer selling products from many manufacturers, showing each brand’s logo builds trust that a generic retailer creative can’t match - especially when reaching cold audiences through Andromeda.
Read the full case study here.
Case study: Bulk increased ROAS by +43%
Bulk, a health and fitness brand, achieved a 43% increase in ROAS by combining Product Assets with dynamic social proof. Each product in their Catalog Ads is paired with a real customer review quote, reviewer name, profile photo, and “Verified Purchase” badge, all pulled automatically from product-level data.
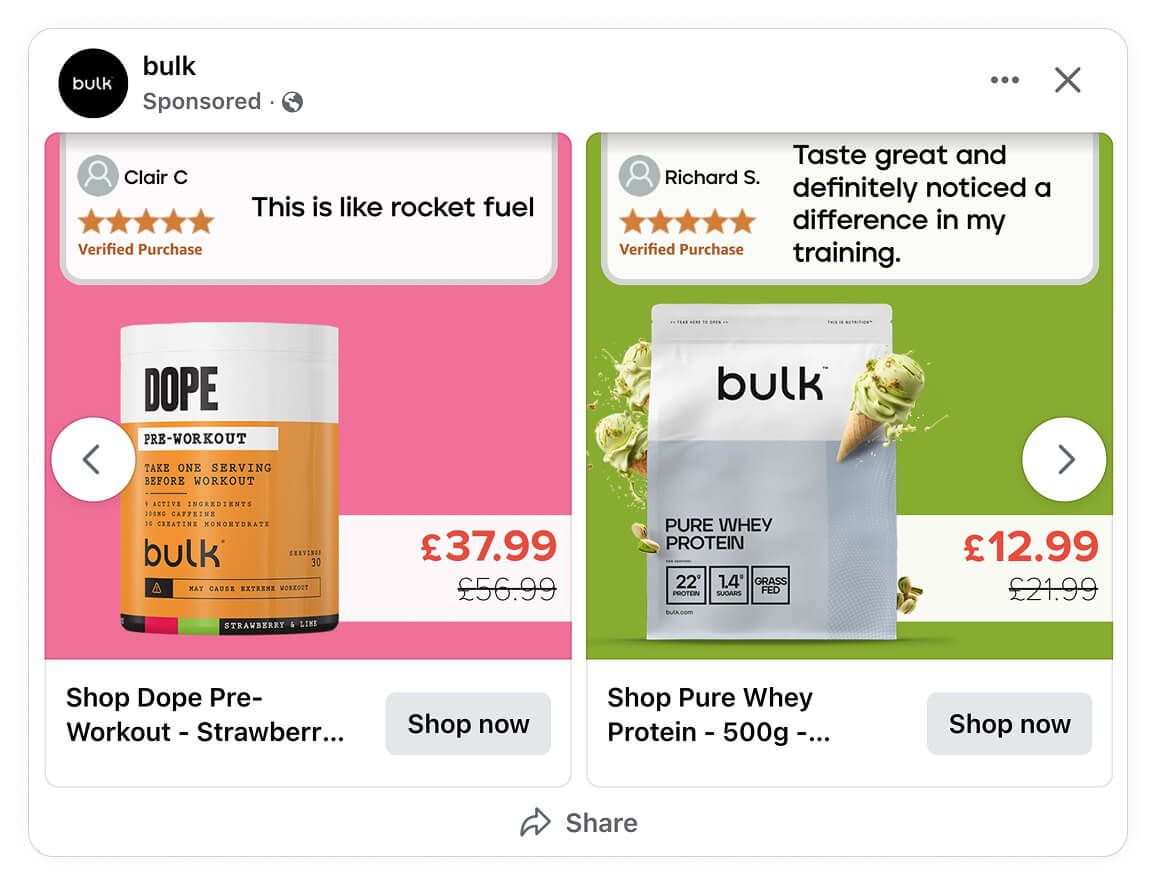
The reviews aren’t generic. They’re matched to each product’s specific benefits and common objections: “Tastes great” for protein powder, “Pushing heavier weights” for creatine, “This is like rocket fuel” for pre-workout.
The result: testimonial-powered Catalog Ads at scale, with zero manual design per product.
Read the full case study here.
Using Video Catalog Ads (+62% adoption gap)
Top performers are 62% more likely to use Video Catalog Ads - the fifth and final advanced tactic.
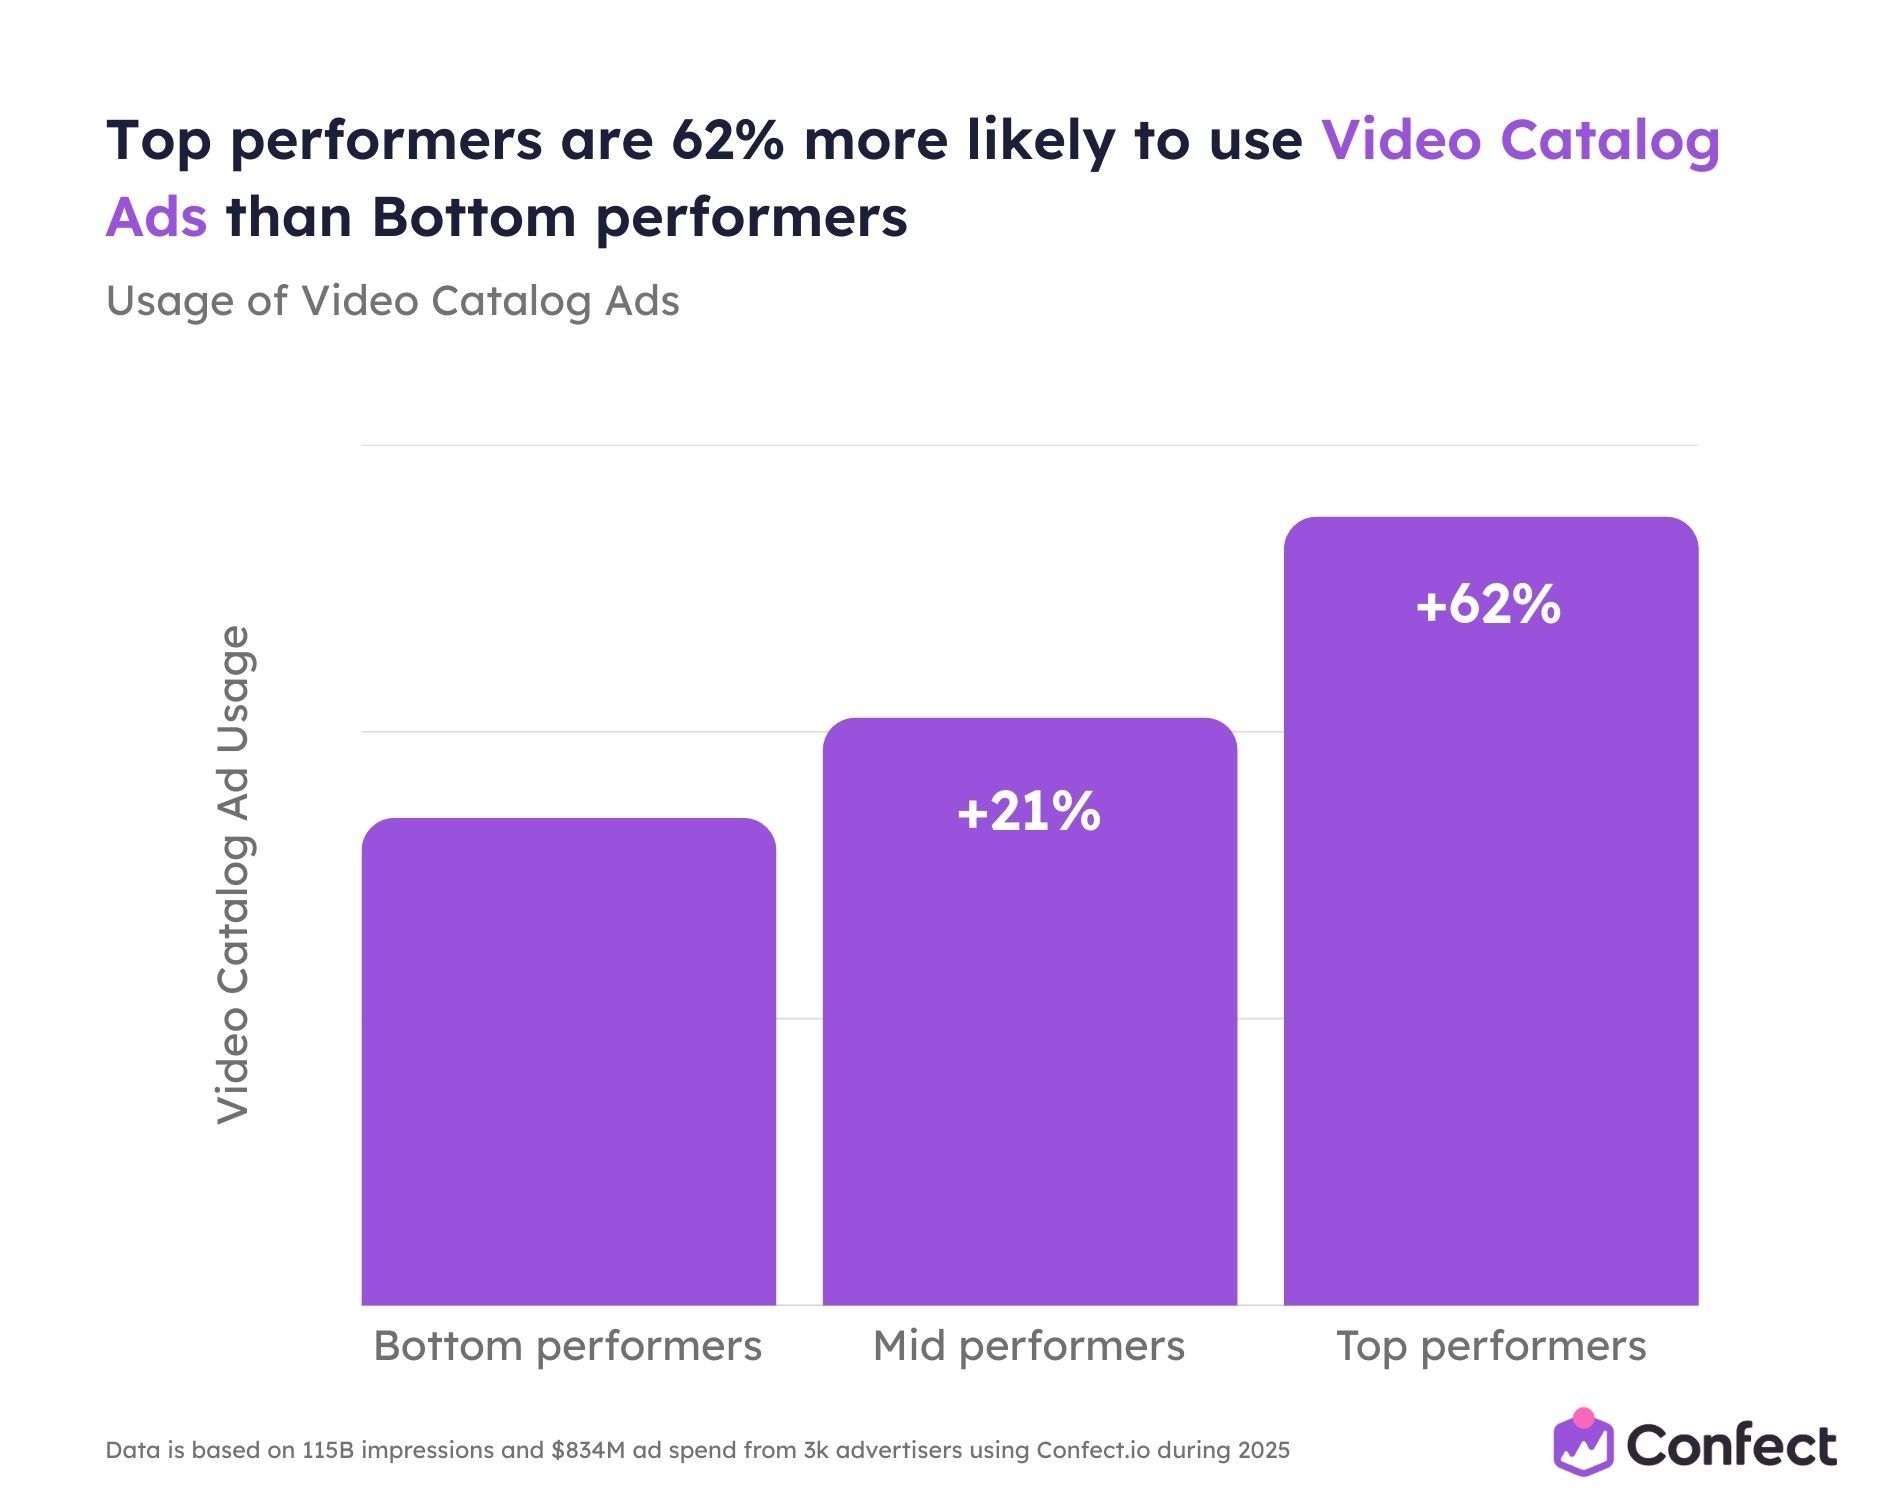
Video Catalog Ads combine the product-level dynamic personalization of Catalog Ads with the engagement power of video. They simultaneously satisfy Andromeda’s demand for creative diversity and Meta’s aggressive push toward video-first content across Reels and Stories.
Like Product Assets, the adoption pattern shows a split: mid performers are only 21% ahead of bottom performers, but top performers leap to 62%. This is an advanced capability that the most sophisticated advertisers have embraced while the majority of the market lags behind.
Video Catalog Ads register as entirely different entity types in Andromeda’s clustering system compared to static Catalog Ads of the same product. That effectively doubles the retrieval opportunities for any product that has both a static and video creative.
Andromeda’s computer vision extracts richer signals from video than from static images - motion patterns, product demonstration sequences, visual storytelling cues - giving the retrieval engine more data for precise user matching.
Case study: Baum und Pferdgarten & Besocial got a +36% higher ROAS with Product Level Videos
Baum und Pferdgarten, working with agency Besocial, achieved 36% higher ROAS when using Video Catalog Ads that dynamically animated product images into short video sequences. No expensive video shoots required - the videos were generated automatically from static product imagery, making the approach scalable across the entire catalog.
Read the full case study here.
The compounding effect
Each of these five tactics is powerful on its own. But the real advantage comes from combining them.
A Catalog Ad using all 5 advanced tactics - 5+ design variants, multiple placement formats, Design Rules, Product Assets, and Video - creates the most complete creative ecosystem that Andromeda can work with. Each layer multiplies the number of distinct visual entities the retrieval engine can evaluate, giving you exponentially more paths through the auction.
Think of it as a multiplication problem:
500 products × 5 design variants × 3 placement formats × 3 Design Rules × 2 formats (static + video) = tens of thousands of unique creative combinations.
That’s tens of thousands of retrieval tickets. All from one product catalog.
No amount of manual static ad production can compete with that kind of scale.
Your Andromeda Action Plan
You’ve seen the data. Here’s how to act on it.
This chapter distills the study’s findings into a prioritized checklist, organized by impact and effort. Not everything needs to happen at once. But the order matters. Start at the top and work your way down.
Priority 1: The quick wins (do this week)
These changes require zero creative production and can be implemented inside Meta Business Manager in minutes.
Audit your landing pages. Identify every active ad sending traffic to a category or collection page. Test switching these to the specific product page or your homepage. Category pages collapsed by 24% under Andromeda. Product pages and homepages improved. This is the single fastest performance fix available.
Check your Catalog Ad count. If you have fewer than 39 live Catalog Ads, you’re below the bottom performer benchmark. If you’re below 67, you’re below the top performer benchmark. Know where you stand.
Calculate your Catalog Ad spend share. What percentage of your total Conversion campaign budget goes toward Catalog Ads? If it’s below 30%, you’re in the lowest-performing tier. The data shows every step up in Catalog Ad allocation improves ROAS, CPA, CTR, and CPM simultaneously.
Expand your targeting. If you’re still running narrow interest targeting or small lookalike audiences, broaden them. Andromeda’s creative-first matching makes narrow targeting largely redundant. Broad targeting delivered 49% higher ROAS compared to lookalike targeting in external data.
Priority 2: The structural shifts (this month)
These require some planning but set the foundation for sustained performance improvement.
Start shifting budget from static ads to Catalog Ads. Move in increments of 10–15 percentage points per month. Measure ROAS and CPA changes at each stage. The data shows performance improves progressively; advertisers at 60–100% Catalog Ad spend achieve 44% higher ROAS and 68% lower CPA compared to those below 30%.
Launch Catalog Ads in prospecting. If your Catalog Ads are only running in retargeting, you’re missing the full-funnel flywheel. Prospecting ROAS reaches 10 for high Catalog Ad spenders - higher than most advertisers’ total account average. More prospecting catalog spend creates larger retargeting pools, which Catalog Ads then convert at exponentially higher rates.
Consolidate your campaign structure. Fewer ad sets with more diverse creatives outperform fragmented structures. A controlled test showed one ad set with 25 diverse creatives beat a 5-ad-set structure by 17% on conversions and 16% on cost.
Upload your full product catalog. If you have products that aren’t in your Meta catalog, add them. Every product is a unique creative that Andromeda can match to a distinct user segment. A catalog with 5,000 products gives the algorithm 5,000 entry points. Don’t hold back your long-tail inventory, Andromeda’s precision matching can find audiences for niche products that would never sell through manual targeting.
Implement server-side tracking. If you’re still relying on pixel-only tracking, set up the Conversions API with proper deduplication. High Event Match Quality scores directly improve how often your ads make it through Andromeda’s retrieval gate.
Priority 3: The creative system (this quarter)
These require investment in creative infrastructure but deliver the largest long-term competitive advantage.
Create at least 5 genuinely different Catalog Ad design variants. Not minor color tweaks. Genuinely different visual approaches. A price-focused layout. A lifestyle overlay. A social proof design. A minimal product-only template. A seasonal campaign version. Top performers are 38% more likely to cross this threshold.
Design for multiple placement formats. Create Catalog Ad designs in at minimum three aspect ratios: 1:1 for Feed, 4:5 for mobile Feed, and 9:16 for Stories and Reels. Top performers are 75% more likely to do this. SOFACOMPANY saw 85% higher ROAS from this change alone.
Implement Design Rules. Set up at least 3 conditional rules: one for products on sale (showing discount percentage), one for seasonal or promotional messaging (activated during campaign periods), and one for urgency signals (low stock, delivery deadlines). Top performers are 103% more likely to use Design Rules - the largest gap in the entire study.
Add Product Assets. Start with brand logos for multi-brand retailers, or star ratings and review counts for brands with strong social proof. HiFi Klubben saw +48% ROAS from brand logos. Bulk saw +43% ROAS from dynamic review quotes. Most of your competitors haven’t implemented this yet - only 6% more mid performers use Product Assets than bottom performers, so the first-mover advantage is significant.
Build a Video Catalog Ad layer. Add video versions of your Catalog Ads on top of your existing static catalog creatives. Video and static register as different entity types in Andromeda’s system, so they reach different audiences rather than competing. Start with tools that automatically animate static product images into short video sequences.
Shorten your creative refresh cycle. Build a production pipeline that delivers fresh concepts every 2–3 weeks. Static ads should rotate every 2–3 weeks. Catalog Ad design templates can run longer at 4–6 weeks. If an ad hasn’t performed by the end of its first week, don’t wait; replace it with something genuinely different.
Priority 4: The organizational change (ongoing)
This is the hardest part - but the data makes it clear it’s necessary.
If you’re a big advertiser, cut your creative approval cycle by at least 50%. Big advertisers are hurt the most under Andromeda, and the study explicitly names the reason: slow creative approval processes. This is an organizational problem disguised as a platform problem. No amount of media buying optimization will fix it if internal workflows can’t produce and approve new creatives fast enough.
Build a tiered approval system: high-production brand assets go through full review, while lower-fidelity Catalog Ad templates, UGC clips, and product-focused creatives follow a fast-track process with lighter oversight.
Track new KPIs. Add these to your reporting alongside ROAS and CPA:
- Active ad count (are you maintaining enough live creatives?)
- Catalog Ad spend share (are you allocating enough budget to catalogs?)
- Catalog Ad revenue share (are you trending toward the 60% benchmark?)
- Post-click conversion rate (is your website keeping pace with Andromeda’s new traffic type?)
- Creative refresh rate (how often are you launching genuinely new concepts?)
Treat creative diversity as a competitive advantage, not a production burden. The old game was finding one winning ad and scaling it. The new game is building a system that continuously feeds the algorithm diverse, fresh creative - and Catalog Ads are the most efficient way to do that at scale.
One final thought
Andromeda is not going away. It’s not a temporary disruption that will self-correct. The data shows no recovery signal at any point in the rollout.
But the same data also shows a clear, concrete, evidence-backed path to winning under the new system. The advertisers who have adapted aren’t just surviving, many of them are performing better than they were before Andromeda.
The playbook has changed. The question is whether you’ll change with it.
All the data in this ebook - the 7% ROAS decline, the 31% top performer hit, the 24% category page collapse, the 23% Catalog Ad advantage, the 103% Design Rules gap, and every other finding - comes from 115.7 billion impressions across 3,014 real eCommerce advertisers. It’s not theory. It’s what happened.
Now it’s your move.