What is Return On Ad Spend and how to improve ROAS (with ROAS benchmarks)
April 10, 2025
How do you know if your ads are truly making you money?
Enter ROAS – Return on Ad Spend – the headline metric for e-commerce businesses running paid social campaigns.
ROAS, used for Facebook ads and many other platforms, tells you precisely how much revenue you're generating for every dollar spent on ads. What your Return is on your Ad Spend.
However, while simple in essence, ROAS comes with its fair share of nuances. You can’t take any advertising metric at face value without understanding its underpinning mechanics – and ROAS is no different.
That’s why we’ve created this guide – to unpack everything about ROAS, how it compares to other metrics, what numbers you should aim for, and how to boost your ad performance.
Whether you're just starting out in the world of advertising or are looking to level up your campaigns, mastering ROAS will help you make smarter, more profitable decisions.
What Is ROAS? Understanding Return On Ad Spend for eCommerce
In the simplest possible terms, ROAS measures how much revenue your ads generate compared to what you spend on them.
It answers a fundamental question: "For every dollar I put into ads, how many dollars do I get back in sales?" The higher your ROAS, the more efficient your advertising, with some caveats we’ll cover shortly.
How to Calculate ROAS: The Simple ROAS Formula
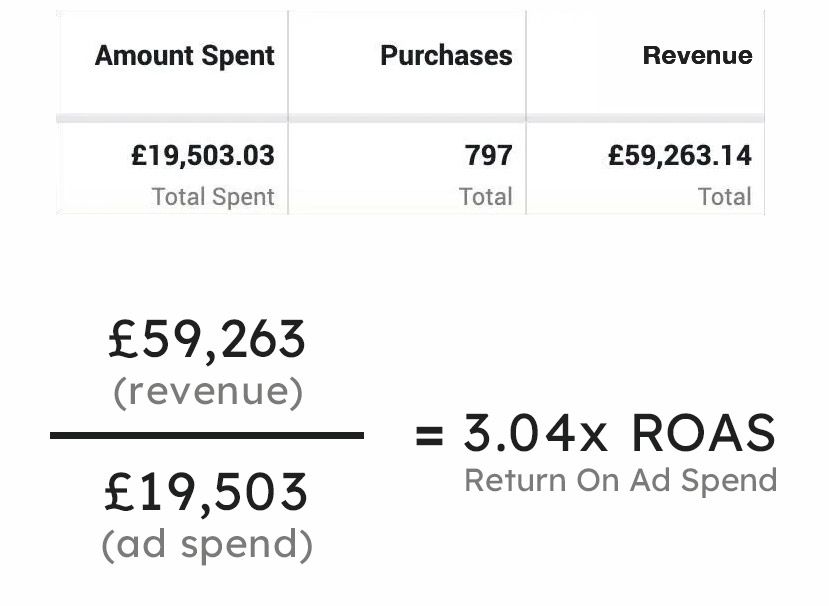
To calculate ROAS, divide your total revenue from ads by your total ad spend.
ROAS = Revenue ÷ Ad Spend
This gives you a ratio or multiplier. For example, if you earn $500 in revenue from $100 in ad spend, your ROAS would be 5 ($500 ÷ $100 = 5). Thus, you earn $5 in revenue for every $1 spent on advertising. It could be expressed as "5x ROAS" or "500% ROAS" – they mean the same thing.
Use Our Free ROAS Calculator Tool
We have made a ROAS calculator for you, so it is easy for you to calculate your Return On Ad Spend:
Why ROAS Matters for eCommerce Advertising
ROAS forges a simple mathematical relationship between marketing costs and actual sales.
E-commerce businesses naturally operate in an environment where ad costs constantly fluctuate and competition for customer attention is fierce.
ROAS is among the most effective methods to identify which campaigns, products, and audiences deliver the best returns, so you can allocate your budget where it generates the most sales.
Optimizing for ROAS vs Cost Per Purchase (CPA) or CTR
While ROAS is often considered the gold standard for measuring ad performance, it’s definitely not the only useful metric available. CPA and CTR are also valid and useful for measuring your campaigns.
Let's examine when it’s appropriate to use each metric and how they impact your optimization strategy:
Pros and Cons of ROAS for Facebook Ad Performance
ROAS is brilliant for measuring exactly how much money your ads bring in relative to your spending. Here are the three key advantages:
- Find your most profitable products: Identify exactly which items make you the most revenue compared to their ad cost.
- Cut campaigns that waste money: Quickly identify which ads aren't earning their keep, so you can redirect that budget.
- See which price points actually sell: Discover if your expensive or affordable products give you better returns on ad spend.
However, ROAS also has some notable blindspots that we have to acknowledge:
- It ignores profit margins: High ROAS on low-margin products might make less money than lower ROAS on high-margin items.
- New customers look the same as repeat buyers: A first purchase that leads to years of sales counts the same as a one-time buyer.
- Attribution limitations: Most ROAS calculations only capture immediate or short-window conversions, potentially undervaluing campaigns that influence purchases made later.
When to Use CPA (Cost Per Purchase) Instead of ROAS
It’s sometimes appropriate to focus on generating a high volume of orders rather than maximizing revenue. In these cases, Cost Per Purchase (often called CPA – Cost Per Action) becomes a better optimization target.
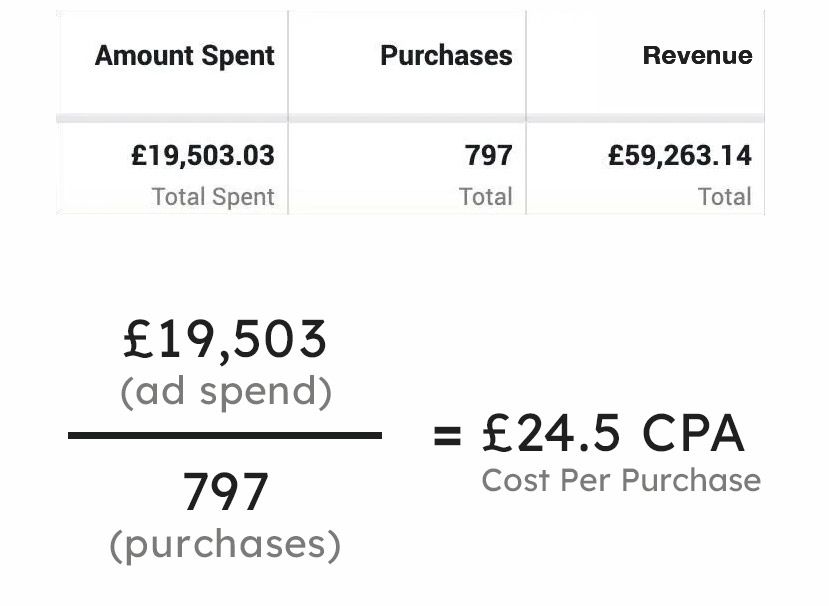
CPA tells you exactly how much you're spending on ads to get one person to make a purchase. The lower this number, the more efficiently you're generating orders.
For example, a $50 Cost Per Purchase means you're spending $50 in advertising to generate each order in your store. If your primary goal is building customer volume rather than immediate revenue, this metric helps you optimize your campaigns accordingly.
This typically applies to:
- Subscription businesses where the first purchase might be break-even but the lifetime value is substantial
- New brands focused on building market share and a customer base they can sell to repeatedly
- Companies with high-margin add-ons or upsells that occur after the initial purchase
- Businesses with strong email marketing programs that monetize customers over time
Think of it like this: ROAS optimizes for maximum revenue while CPA optimizes for maximum order count. If revenue is your priority, choose ROAS. If order volume matters more, CPA might add more insight.
Why Click-Through Rate (CTR) Still Matters
Don’t forget about CTR – which measures how often people who see your ad click on it.
While less directly tied to sales than ROAS or CPA, CTR helps diagnose campaign issues and optimize the early stages of your conversion funnel.
- A high CTR with low purchase rates suggests people like your ads, but something about your website or offers isn't converting.
- Conversely, a low CTR indicates your ads aren't capturing attention effectively in the first place.
CTR is especially useful when testing new concepts or when you have limited conversion data to work with.
Don’t overlook it entirely, though. A strong CTR indicates your ads resonate with your audience – a vital step toward generating the clicks that eventually lead to revenue.
Warning: Amazing ROAS Metrics Does Not Always = Profit!
Both ROAS and Cost Per Purchase measure revenue or transactions – not actual profit!
A campaign might exhibit a really impressive positive ROAS, but you can still lose money if your margins aren’t substantial enough.
For instance, imagine you spend $1,000 on ads promoting a clearance sale. The campaign generates $4,000 in revenue (4x ROAS), which looks excellent on paper.
However, these products normally sell for $8,000 but you've marked them down 50% to clear inventory. So, if your regular profit margin is only 30%, you're actually losing money despite the strong ROAS.
The math: $4,000 revenue - $1,000 ad spend - $3,200 product cost = $200 loss, even with a seemingly successful 4x ROAS.
The moral of the story is, always factor in your profit margins when evaluating performance. Sometimes, a lower ROAS campaign selling high-margin products can be more profitable than a higher ROAS campaign selling low-margin items.
Break-Even ROAS: How to Know If You're Profitable
To factor your margins into your ROAS calculations, you’ll need to find your break-even ROAS. This tells you exactly when your ads start generating profit compared to covering your costs.
You calculate your own break-even point by dividing 1 by your profit margin (as a decimal).
For example: If your margins are 25%, your break-even ROAS is 4 (1 ÷ 0.25 = 4).
This means you need a 4x ROAS to break even with 25% margins. Every $1 in ad spend generates $4 in revenue, of which $1 is profit (25% of $4), exactly covering your ad cost.
However, with a much higher profit margin of 60%, for example, your break-even ROAS is way lower at 1.7. As such, you need a lower ROAS to turn a good profit from your ads.
This explains why some businesses can thrive with low ROAS numbers while others struggle.
Key Factors That Affect Your ROAS
With an excellent understanding of ROAS under our belts, let’s unpack how to influence it.
You see, ROAS isn't a single metric but the result of multiple factors working together – some you can control immediately, others that take time to optimize.
Let's break down what truly drives your return on ad spend:
Ad Creative Performance: Make a Strong First Impression
Your ad's ability to attract the right clicks affects your ROAS from the start. This isn't just about dressing up your ads with eye-catching visuals – it's about connecting with shoppers who are likely to buy.
CTR is important here, as it tells you how effectively your ad pulls in potential customers. However, you ultimately need qualified traffic – people who click because they genuinely want what you're selling.
.jpg)
Website Conversion Rate and Average Order Value
Even perfect ads fail when they send traffic to an underperforming website. We can analyse this with a couple of useful metrics:
- Conversion Rate, which directly impacts how many clicks become customers. Each percentage point improvement can dramatically lift your ROAS. If you're spending $1,000 on ads with a 2% conversion rate, improving to 3% could mean 50% more revenue without spending more.
- Average Order Value acts as a ROAS multiplier. Imagine two identical campaigns with identical conversion rates – if one generates $200 orders and the other $400 orders, the second will deliver twice the ROAS. Smart product recommendations, bundles, and upsells can significantly boost AOV without affecting your ad costs.
Audience Targeting Quality and Retargeting Impact
Ever seen an ad and thought “what has this got to do with me?!” – that might represent campaign money wasted, negatively affecting ROAS!
Brand relevance and familiarity is paramount to ROAS, hence why retargeting campaigns consistently outperform prospecting in ROAS.
Someone who's visited your site before, browsed products, or even abandoned a cart is far more likely to convert than someone encountering your brand for the first time.
This is sometimes called the "temperature" of your audience – how familiar they are with your brand – is a strong predictor of ROAS performance.
CPM and ad spend efficiency: Spend smarter
Finally, your Cost Per Mille (CPM, meaning cost per thousand impressions) directly impacts your ROAS potential. Lower impression costs mean more room for profit in each sale.
While Meta's algorithms ultimately determine your costs, creating engaging, relevant ads that generate positive user signals typically leads to lower CPMs over time.
ROAS Benchmarks: What Is a Good ROAS in eCommerce?
"What's a good ROAS?" is one of the most common questions we hear. It might sound like a cop-out, but the only ‘correct’ answer is: it depends!
ROAS is deeply personal to your business. A ROAS that would be disastrous for one company might be wildly profitable for another. It all comes down to your profit margins and business model.
How Profit Margins Affect Your Ideal ROAS
First, as we’ve already touched on, your margins impact what a good or bad ROAS is.
A digital product company with a massive 90% profit margin might be thrilled with a 2x ROAS. They're spending $1 to make $2 in revenue, with most of that flowing to the bottom line.
Meanwhile, an electronics retailer with 15% margins might need a ROAS of 6-7x just to break even. They're spending the same $1, but after accounting for product costs, they need much higher revenue to turn a profit.
This is why comparing your ROAS to industry averages can be misleading. Your profitability threshold is what truly matters.
Scaling Ads Lowers ROAS—Here’s Why
Your ad spend scale directly impacts achievable ROAS. When you have a moderate ad spend, you're picking the lowest-hanging fruit – the easiest customers to convert. Meta's algorithms find your ideal customers first.
But as you scale to five or even six figures monthly, algorithms must work harder, finding progressively less ideal customers. This natural "audience exhaustion" means ROAS typically decreases as spend increases.
Many brands see their highest ROAS when they first start advertising, only to watch it decline as they scale – this is normal and expected, not a sign of failure.
ROAS Benchmarks: What’s Considered Poor, Average, and Great
While your specific situation matters most, here are some general benchmarks to consider:
- Below 2.5x ROAS: This is the bottom 25% of advertisers, and is generally considered poor performance. Unless you have exceptional margins or strong downstream customer value, this level typically means you're losing money on advertising.
- 2.5 - 4.5x ROAS: This ROAS is below average, but not part of the worst. Acceptable for high-margin businesses or those with strong repeat purchase behavior. Digital products, subscriptions, and luxury goods with high margins can thrive at this level.
- 4.5 - 9.5x ROAS: This ROAS is above average, but not part of the best. Solid performance for most e-commerce businesses. This range typically means your advertising is profitable if you have average industry margins.
- 10x+ ROAS: This is the top 25% of advertisers. Excellent performance that most e-commerce companies aspire to. At this level, your ads are likely generating significant profit unless you have unusually low margins.
ROAS for Catalog Ads vs. Standard Ads on Facebook
If you're running Facebook ads for e-commerce, you might be missing out on significantly better results if you're still using only standard image or video ads.
Catalog ads (also called Dynamic Product Ads) consistently outperform traditional ads across every key metric – and the difference often proves substantial.
What Are Facebook Catalog Ads and Dynamic Product Ads?
Catalog ads connect directly to your product feed, allowing Meta to dynamically select which products to show each person based on their interests and behaviors.
Instead of manually creating an ad for each product, you create a template that automatically pulls images, titles, prices, and other details from your catalog.
Unlike standard ads, where you choose specific products to feature, catalog ads let Meta's algorithms decide which products from your entire inventory will most likely convert for each person seeing the ad.
For example, if you sell running shoes, catalog ads can automatically display lightweight racing shoes to competitive runners, your stability shoes to overpronators, and budget-friendly options to price-conscious shoppers. And if the consumer is not interested in running shoes at all, your ads will not be shown to that person.
Why Catalog Ads Outperform Traditional Ads
Our data shows that catalog ads dramatically outperform standard ads for e-commerce businesses:
- ROAS: 76% higher for Catalog Ads
- Click-Through Rate: 47% higher for Catalog Ads
- Cost Per Purchase: 36% lower for Catalog Ads
- CPM: 23% lower for Catalog Ads
These are vast improvements. A 76% higher ROAS can transform an unprofitable campaign into a highly profitable one. And with both lower CPMs and higher click rates, you're getting more efficient delivery and better engagement simultaneously.
Catalog Ad Designs That Boost ROAS by Up to 80%
At Confect, we've analyzed thousands of catalog ads across 6.5 billion impressions to identify exactly which design elements boost ROAS and which don't.
Our research reveals that the right design choices can improve ROAS by 80% or more, while some choices can actively harm performance. Here's what we've found:
Top ROAS Boosters
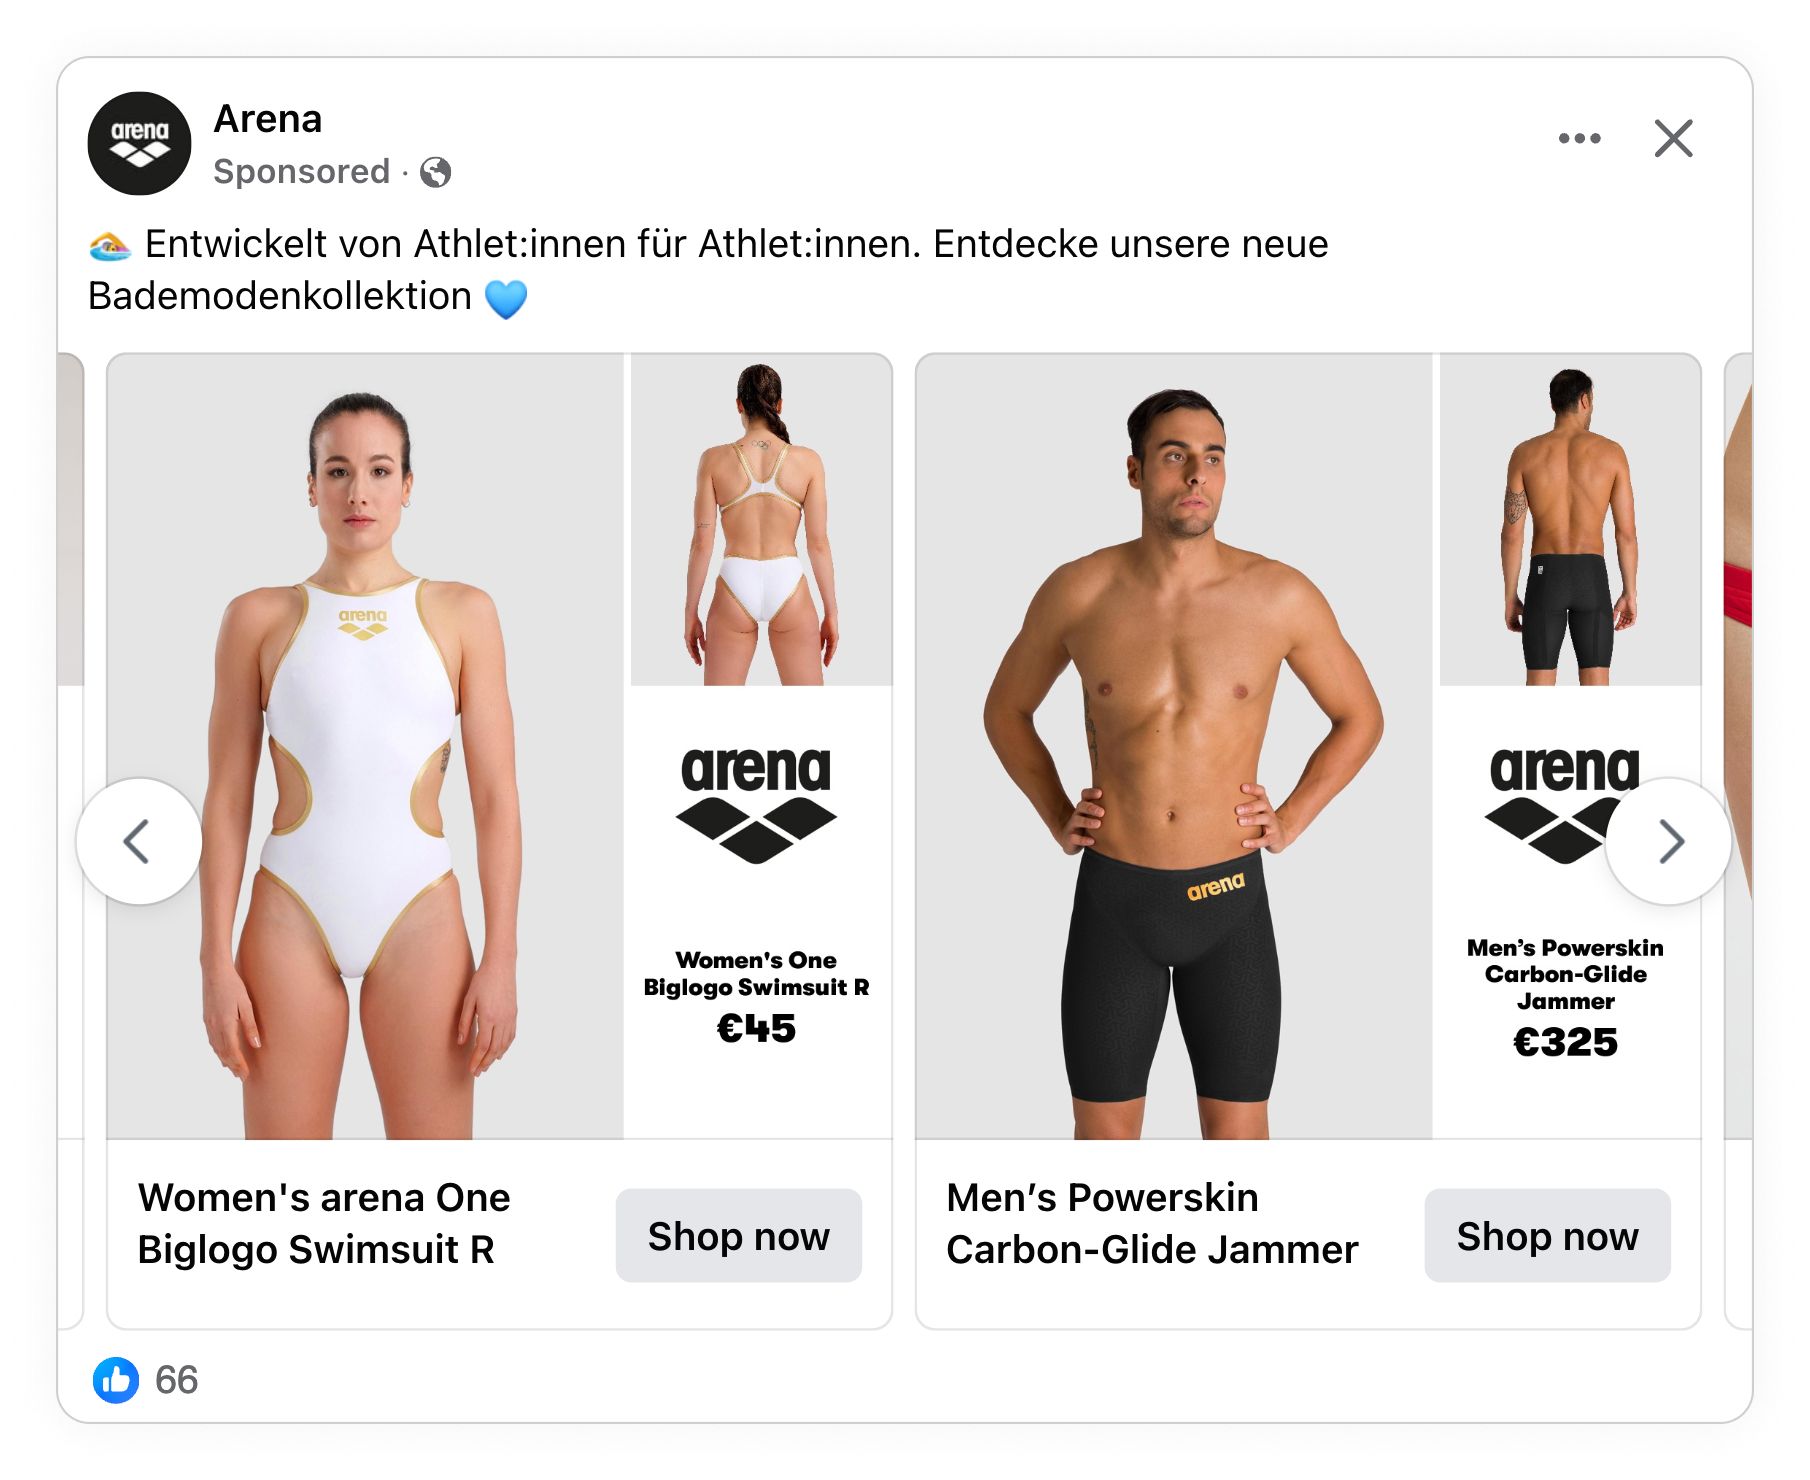
- Product Assets (+80% ROAS): Visual elements like brand logos, feature icons, certification badges, or specification graphics drive the single biggest ROAS improvement. They communicate key product benefits instantly without requiring reading.
- Category Information (+64% ROAS): Helping customers immediately understand what type of product they're looking at creates context that significantly lifts performance.
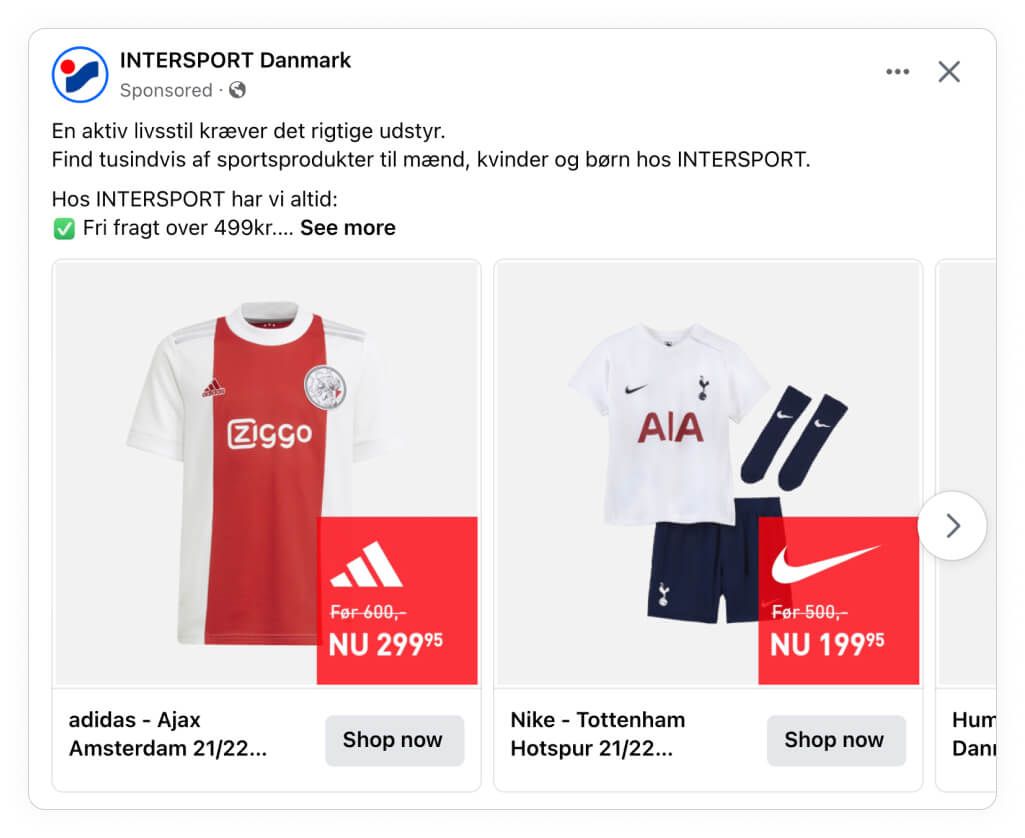
- Savings (+57% ROAS): Highlighting the actual amount saved (either as a percentage or dollar figure) outperforms almost every other element except product assets.
- Sales Badges (+48% ROAS): "On Sale" indicators create urgency and signal value, driving nearly 50% higher ROAS compared to ads without them.
.jpg)
Above: Product Assets can be used to display information like brand logos, ratings with icons like stars or hearts, features like specific Intel processors, and much more.
Moderate ROAS Improvers
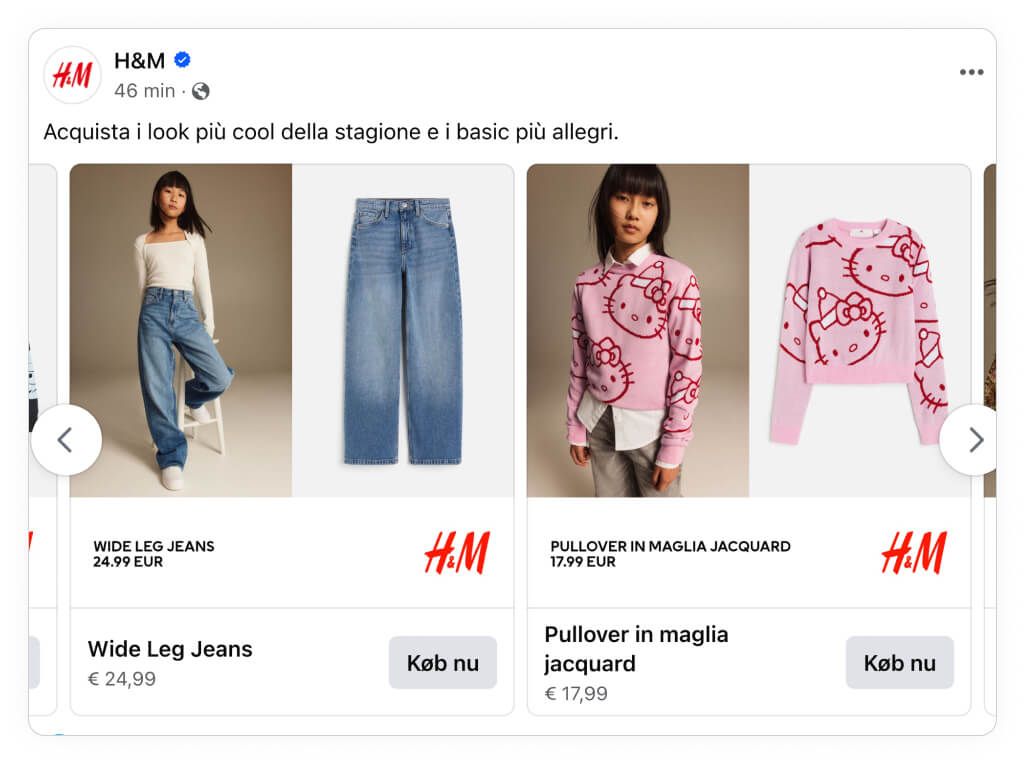
- Brand Names (+44% ROAS): Displaying the product's brand (especially for multi-brand retailers) builds trust and helps customers quickly identify brands they already know and trust.
- Price Display (+41% ROAS): Clearly showing the current price eliminates friction for price-sensitive shoppers who won't click without knowing what to expect.
- Custom Labels (+37% ROAS): Specialized information like "Organic," "Bestseller," or "Limited Edition" helps products stand out and speaks to specific customer interests.
- Social Proof (+31% ROAS): Ratings, reviews, or "Popular Choice" indicators build immediate credibility and reduce purchase hesitation.
- Original Price Comparison (+30% ROAS): Showing the original price alongside the current price helps customers understand the value they're getting.
Above: Mentioning brands is shown to boost ROAS by up to 44%.
Other potential Elements to show
- Product Names (+22% ROAS): While helpful, product names drive less ROAS improvement than other elements.
- Promotional Dates (+14% ROAS): "Sale ends Friday" messaging creates some urgency but has limited impact.
- Logo Display (+7% ROAS): Your store logo provides minimal ROAS benefit in most cases.
- Additional Images (-1% ROAS): Surprisingly, adding multiple product images doesn't improve ROAS and may slightly hurt it.
- Shipping Information (-2% ROAS): Details about shipping typically don't improve performance.
There’s a lot of substance and strategy behind these numbers, so don't take them all at face value! Read our full breakdown of Catalog Ad design performance factors here.
Real Brand Results: How Catalog Ad Optimization Improved ROAS
Let's look at how three real brands boosted their ROAS with better catalog ad designs:
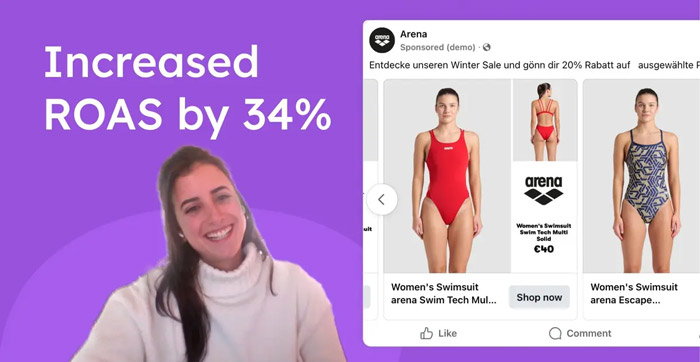
Arena Sports: 34% Higher ROAS from Catalog Ad Redesigns
Arena sells high-performance swimwear in over 100 countries. Their standard catalog ads showed plenty of room for improvement. Here's what worked for them when they began to optimize their campaigns with Confect:
- Testing revealed that showing two product images (even without displaying price) delivered 34% higher ROAS
- They used different designs based on what they were selling – multiple angles for swimwear, simpler layouts for basic items like swim caps
- They made their ads look like mini versions of their product pages, connecting the ad to their site for the user experience
Above: Arena found that front and back images exhibited better performance for swimwear.
Results? 34% higher ROAS, 18% better CTR, and 17% lower cost per click. Read the full case study here.
Vero Moda: 60% Sales Growth with Targeted Catalog Designs
Vero Moda runs 500+ fashion stores across 45 countries. They needed their social ads to work harder in crowded feeds. Here’s the winning formula they developed with Confect:
- Custom designs for different customer groups – their Curve, Maternity, and Girl collections each received unique layouts with relevant information
- Mixing model shots with product close-ups in the same ad, showing both styling and important details
- Adding exact style names like "VMHARUKI blazer" in ads, which drove 25% more Google searches from people who saw their ads
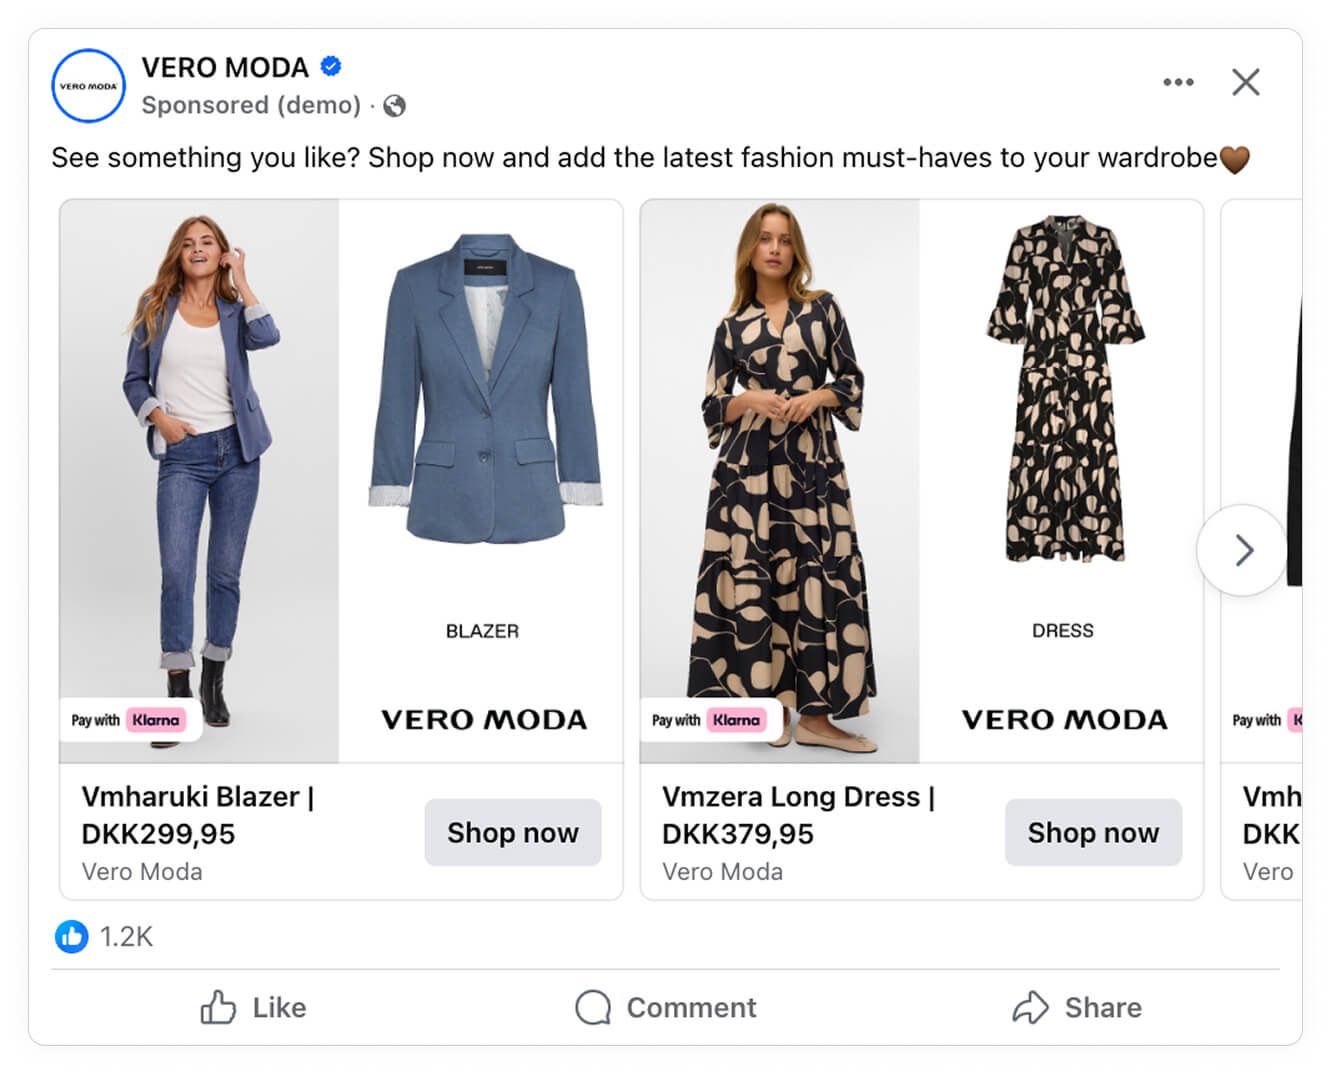
Above: VERO MODA found excellent ROAS from combining a model image and a pack shot together.
The payoff was substantial: 60% sales increase and 46% traffic growth year-over-year. Read the full case study here.
Humac: 42% Conversion Rate Lift from Personalization
Humac is Scandinavia's biggest Apple retailer. They made simple but effective changes to their catalog ads:
- For expensive products: "Buy now, pay later" options with monthly payment amounts clearly shown
- For seasonal purchases (Christmas): Highlighting their 100-day return policy
- For students: Showing exact prices after student discounts
- For Stories and Reels: Creating true vertical designs instead of square formats
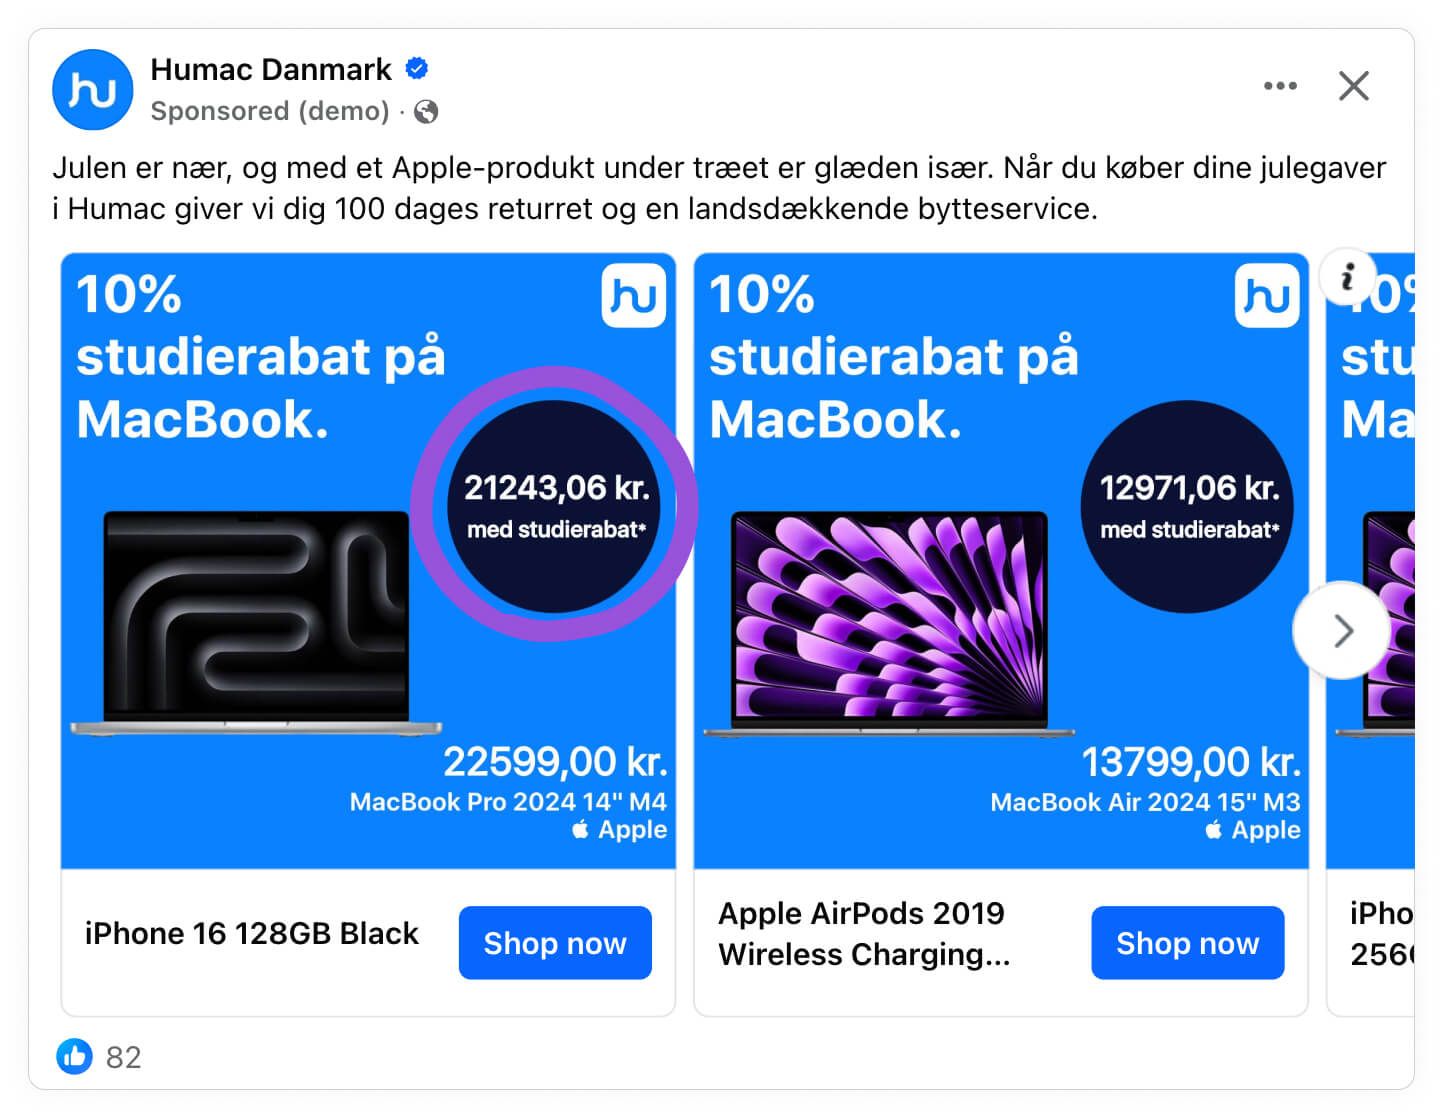
Above: An example of Humac’s in-ad student discount.
These relatively straightforward tweaks led to 42% higher conversion rates and 23% better CTR. Read the full case study here.
The lesson from all three? Catalog ads drive better ROAS when they're built for specific products and audiences, not just as generic product showcases.
Final Thoughts: Mastering ROAS for Better Facebook Ad Results
Understanding and optimizing your ROAS is one of the most powerful ways to improve your e-commerce advertising results. It’s a deceptively simple metric – the very best marketers understand both its strengths and boundaries.
Remember these key takeaways:
- ROAS directly connects your ad spending to revenue generation
- Your ideal ROAS target depends on your specific profit margins
- Multiple factors influence ROAS - from ad creative to website performance to audience selection
- Catalog ads typically deliver significantly higher ROAS than standard ads
- Specific design elements can dramatically improve your catalog ad performance
With our strategies for enhancing your ROAS, you'll be well on your way to more profitable advertising and sustainable e-commerce growth.