Image ads vs. Video ads. Which performs better?
January 17, 2023
Today, we’re talking about the million-dollar question that has kept advertisers scratching their heads for ages: which is better, image ads or video ads?
With Facebook being one of the largest advertising platforms, it's no secret that marketers can create both video and image ads to capture their audience's attention, winning over both their hearts and their wallets.
But the question remains: which in-feed product ad formats reign supreme in terms of conversions, purchase rates, and overall performance?
Today, we're about to unveil the results of an in-depth study that has analyzed over 12 billion impressions' worth of data to finally put this debate to rest.
So sit tight and get ready to discover how image and video ad format stacks up against each other!
Video ads on average have a 24% higher cost-per-purchase than image ads
Before we dive into the actual performance metrics, let’s first take a broader look at which format is more cost-effective in terms of generating purchases.
Our analysis revealed that video ads have a cost per purchase that is a whopping 24% higher than image ads.
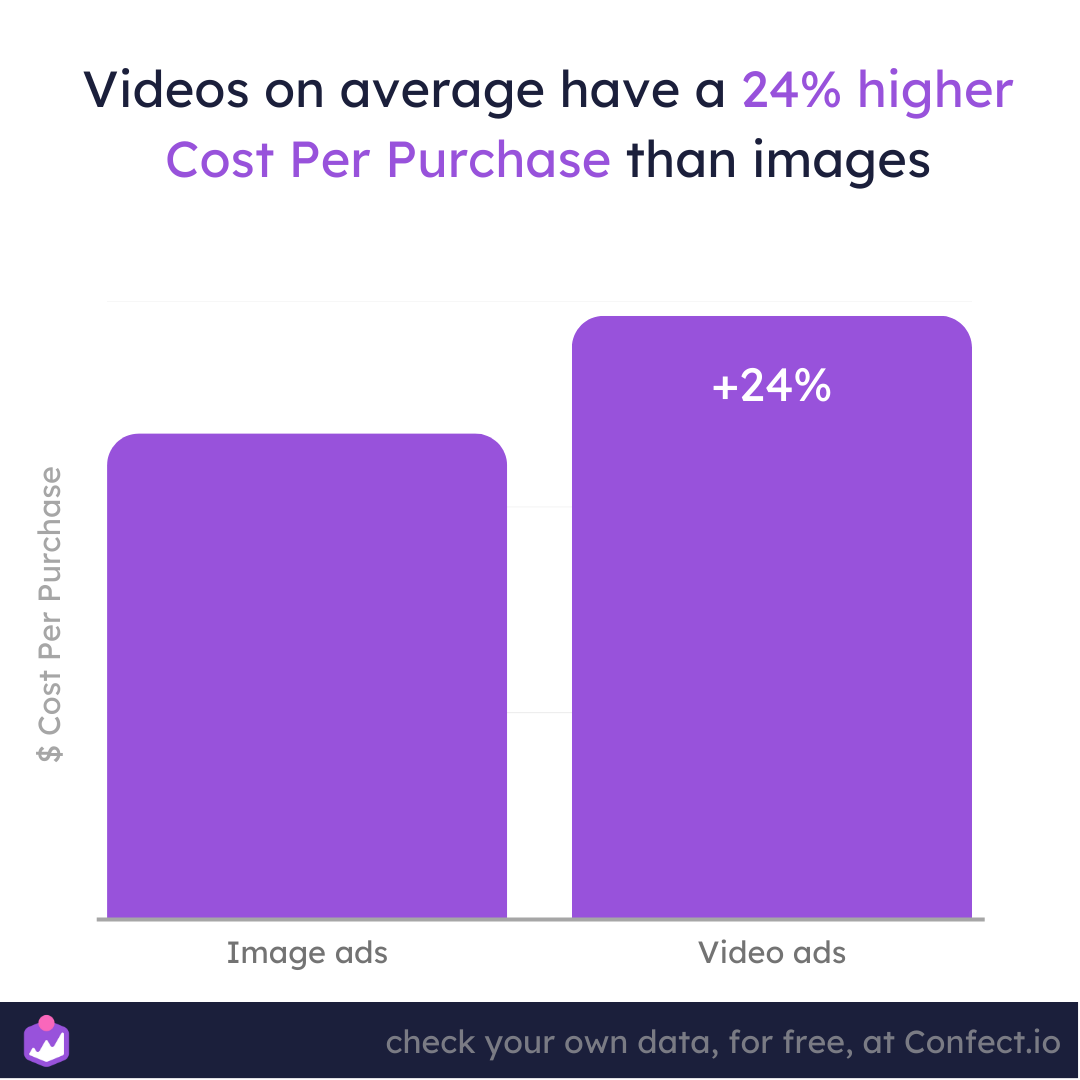
So when it comes to cost-effectiveness and getting the most bang for your buck, image ads are the better choice.
This is partly explained by the fact that video ads have a higher cost per one-thousand impressions (CPM). In fact, on average, video ads are about 17% more expensive just to display in the first place.
So, video ads are the less cost-friendly option!
But that doesn’t answer our questions about which ad format is more effective!
Video ads have a 7% lower click-through rate than image ads
Next up, we compared click-through rates for both image and video ads, and found that image ads generally have a higher click-through rate.
7% may not be a massive difference, but the data suggests that users are generally less likely to click on a video ad.

So, if you want to stretch your advertising budget as far as possible, and bring in more clicks from your ad viewers at the same time, image ads are the clear winner.
But is there ever a scenario where videos are the better choice? Let's dive a bit deeper and see if there are any exceptions to the rule.
Top-funnel video ads have a 26% higher cost-per-purchase
Top funnel ads are typically displayed to a broad audience and focus on generating interest and curiosity rather than driving immediate sales.
Also known as awareness or audience building ads, top-of-funnel ads are designed to introduce your brand, product, or service to an audience who likely isn’t yet familiar with it.
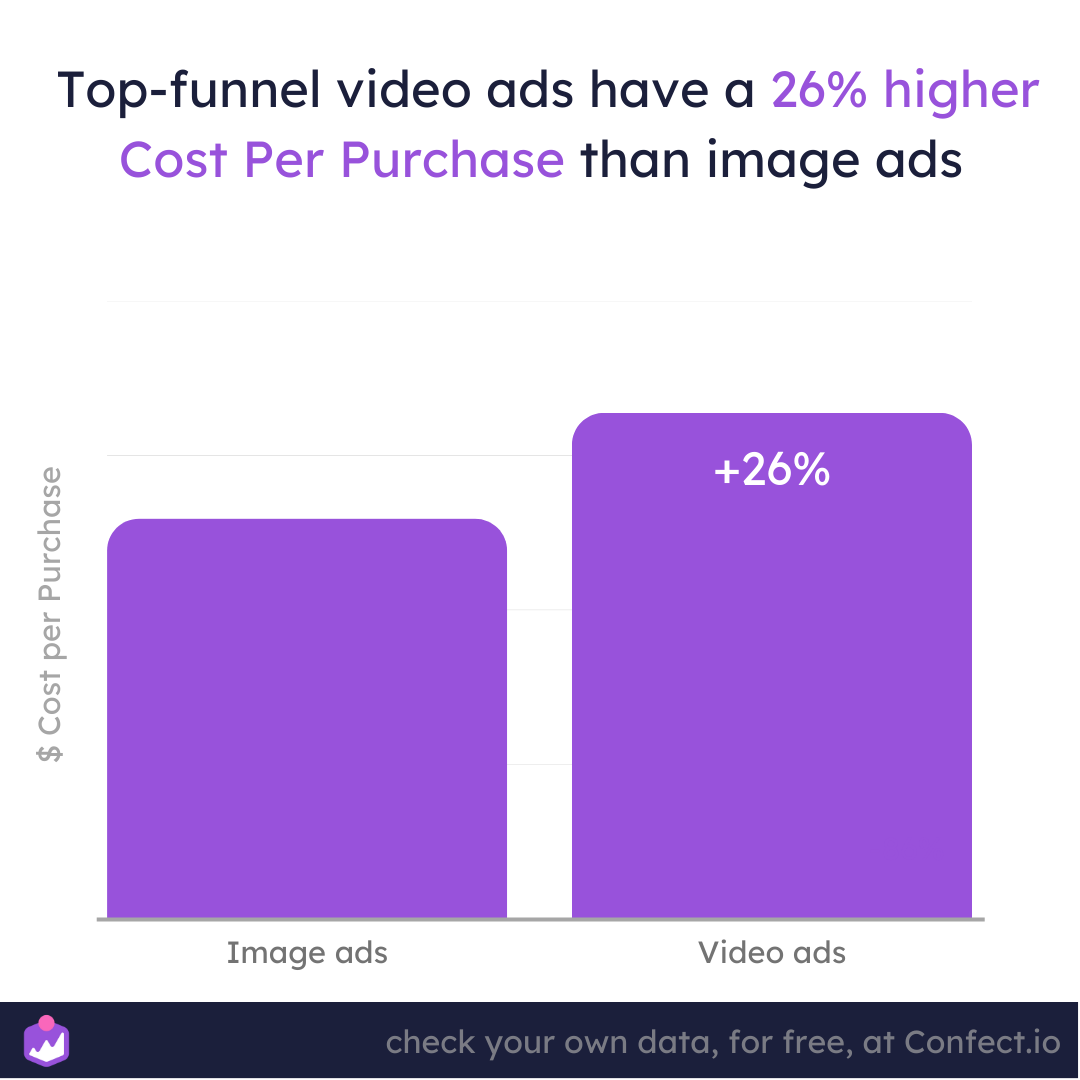
And once again, we found video ads used for top-of-funnel marketing have a higher cost per purchase by about 26% when compared to image ads.
But what does that say about bottom-of-funnel ads?
If you’re running top-funnel campaigns with video, this guide on Catalog Ads for prospecting can help you optimize performance despite the higher costs.
For remarketing, image & video ads have almost the same costs-per-purchase
Picture this: a potential customer visits your website, they browse around, but they don't quite take the leap to hit that "buy now" button.
Frustrating, right?
But fear not! This is where remarketing comes into play!
Remarketing is just a fancy term for targeting ads specifically to users who have shown some interest in your brand, but didn't convert into buyers.
And guess what? They're more likely to listen to your message and take notice of your future offers than those who haven't heard of you before.
But here's where it gets really interesting: when it comes to remarketing ads, the difference between image and video ads drops significantly.

That's right, the difference between image ads and video ads shrinks when running top-funnel ads, bringing video ads used for remarketing pretty much in line with the cost of image ads used for remarketing!
While video ads have a lower cost-per-purchase by a mere 3%, the data shows that for videos to be effective, your target group needs to already have some interest in your brand, which is true for all remarketing advertising efforts.
That way, they're more likely to spend the time to watch and engage with your content.
So, when it comes to purchases and conversions, image ads are the safer option overall.
But what if you're after more than just converting another customer?
For instance, what if your goal is to increase engagement as much as possible?
On average, video ads get 6x more engagement than image ads
Sure, purchases and conversions are great, but have you ever thought about the power of having your viewers simply interact and engage?
When it comes to creating a buzz around your brand, video ads are the ultimate advertising tool.
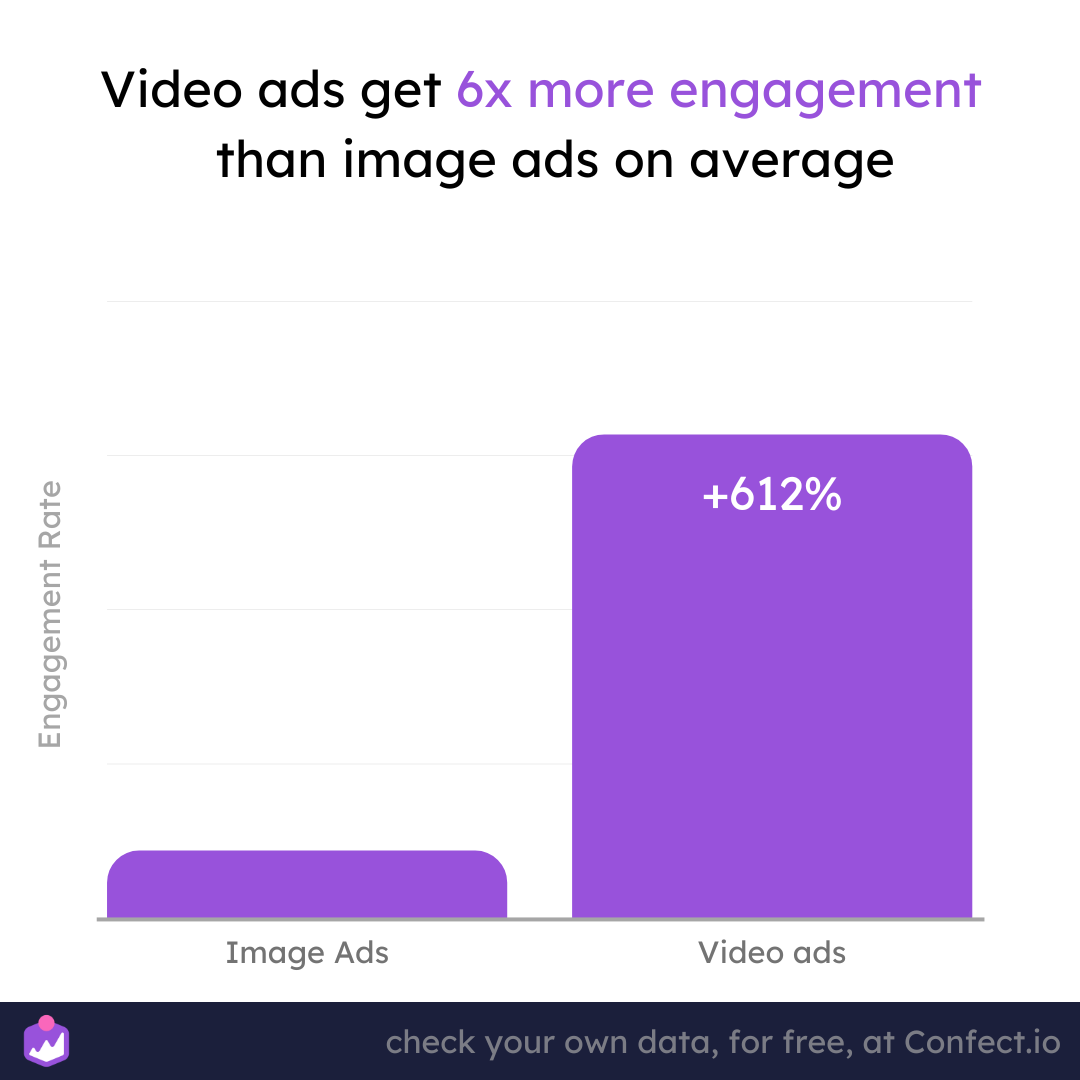
In fact, on average, video ads receive a whopping 612% more likes and comments than image ads.
That's right, we're talking about six times more engagement!
So, if you're looking to really connect with your audience and get them excited about your brand, videos are the way to go.
They have the ability to captivate your audience, inspire them to take action, and ultimately create a loyal community of followers, which is exactly what you need if you want your brand to become successful in the longer-term.
Want to make the most of that engagement? Here’s how to create Video Catalog Ads and Product-Level Videos that convert.
Which performs better? Images or videos?
Realistically, whether image or video ads perform better depends on your advertising goals.
For conversion campaigns and top-funnel advertising, image ads are the clear winner.
They have a lower cost of advertising (CPM), lower cost per purchase (CPP), and a higher click-through rate (CTR).
However, for remarketing, video ads are slightly more effective as these audiences have already shown some interest, and are more likely to pay attention to your message.
But where videos truly shine is in engagement campaigns.
They receive an average of 612% more likes and comments than image ads, making them the perfect choice for building a deeper, longer-lasting relationship with your audience.
So, the next time you're deciding on which ad format to use, consider your overall campaign goal and, hopefully, our data can help you make the better choice!
The truth is: both can win if used right - see how the best eCommerce brands succeed with both in Advantage+ Shopping Campaigns.
Data section:
The dataset from this article is based on 12.7B+ impressions and 117K pieces of individual content on Meta (Facebook) platforms. It takes into account data from all countries and industries, with the campaign objective of Conversions. The period is from 1. September 2021 - 29. January 2023.
Numbers are looking at correlation only, not causation. Remember to check your own data: numbers for different brands, industries, and contexts will vary.
Find the ultimate guide for designing catalog ads on Facebook here.
Try Confect for Free
Confect can help you to create great-looking Catalog ads and Dynamic Product ads for Facebook, Instagram, TikTok, Snapchat and Pinterest.