Catalog Ads in top-funnel ads and prospecting
October 14, 2024
Bookmark this page by pressing ctrl + D / cmd + D, or by clicking the star icon in your URL bar ⭐️.
Here you have the insights in a quick cheat sheet - click to get more details:
The most used product fields in Catalog Ads designs:
The moderately used product fields in Catalog Ads designs:
The rarely used product fields in Catalog Ads designs:
Showing Prices in your Catalog Ads
The lower your customer is in your marketing funnel, the better Catalog Ads with prices typically perform compared to Catalog Ads without prices.
- Top-funnel ads see a +31% improvement in Return on Ad Spend when showing prices
- Bottom-funnel ads see a +54% improvement in Return on Ad Spend when showing prices
You can learn more about showing prices in your Catalog Ads right here.
Here's how showing prices on average influence Catalog Ads:
Return On Ad Spend
+31%
Cost Per Purchase
-19%
Click Through Rate
-13%
Cost Per Click
-14%
Conversion Rate
-9%
Usage
48%
These numbers show how Catalog Ads showing prices perform on average compared to Catalog Ads not showing prices.
Remember that these are average numbers. For some brands, prices perform better, and for other brands, prices perform worse.
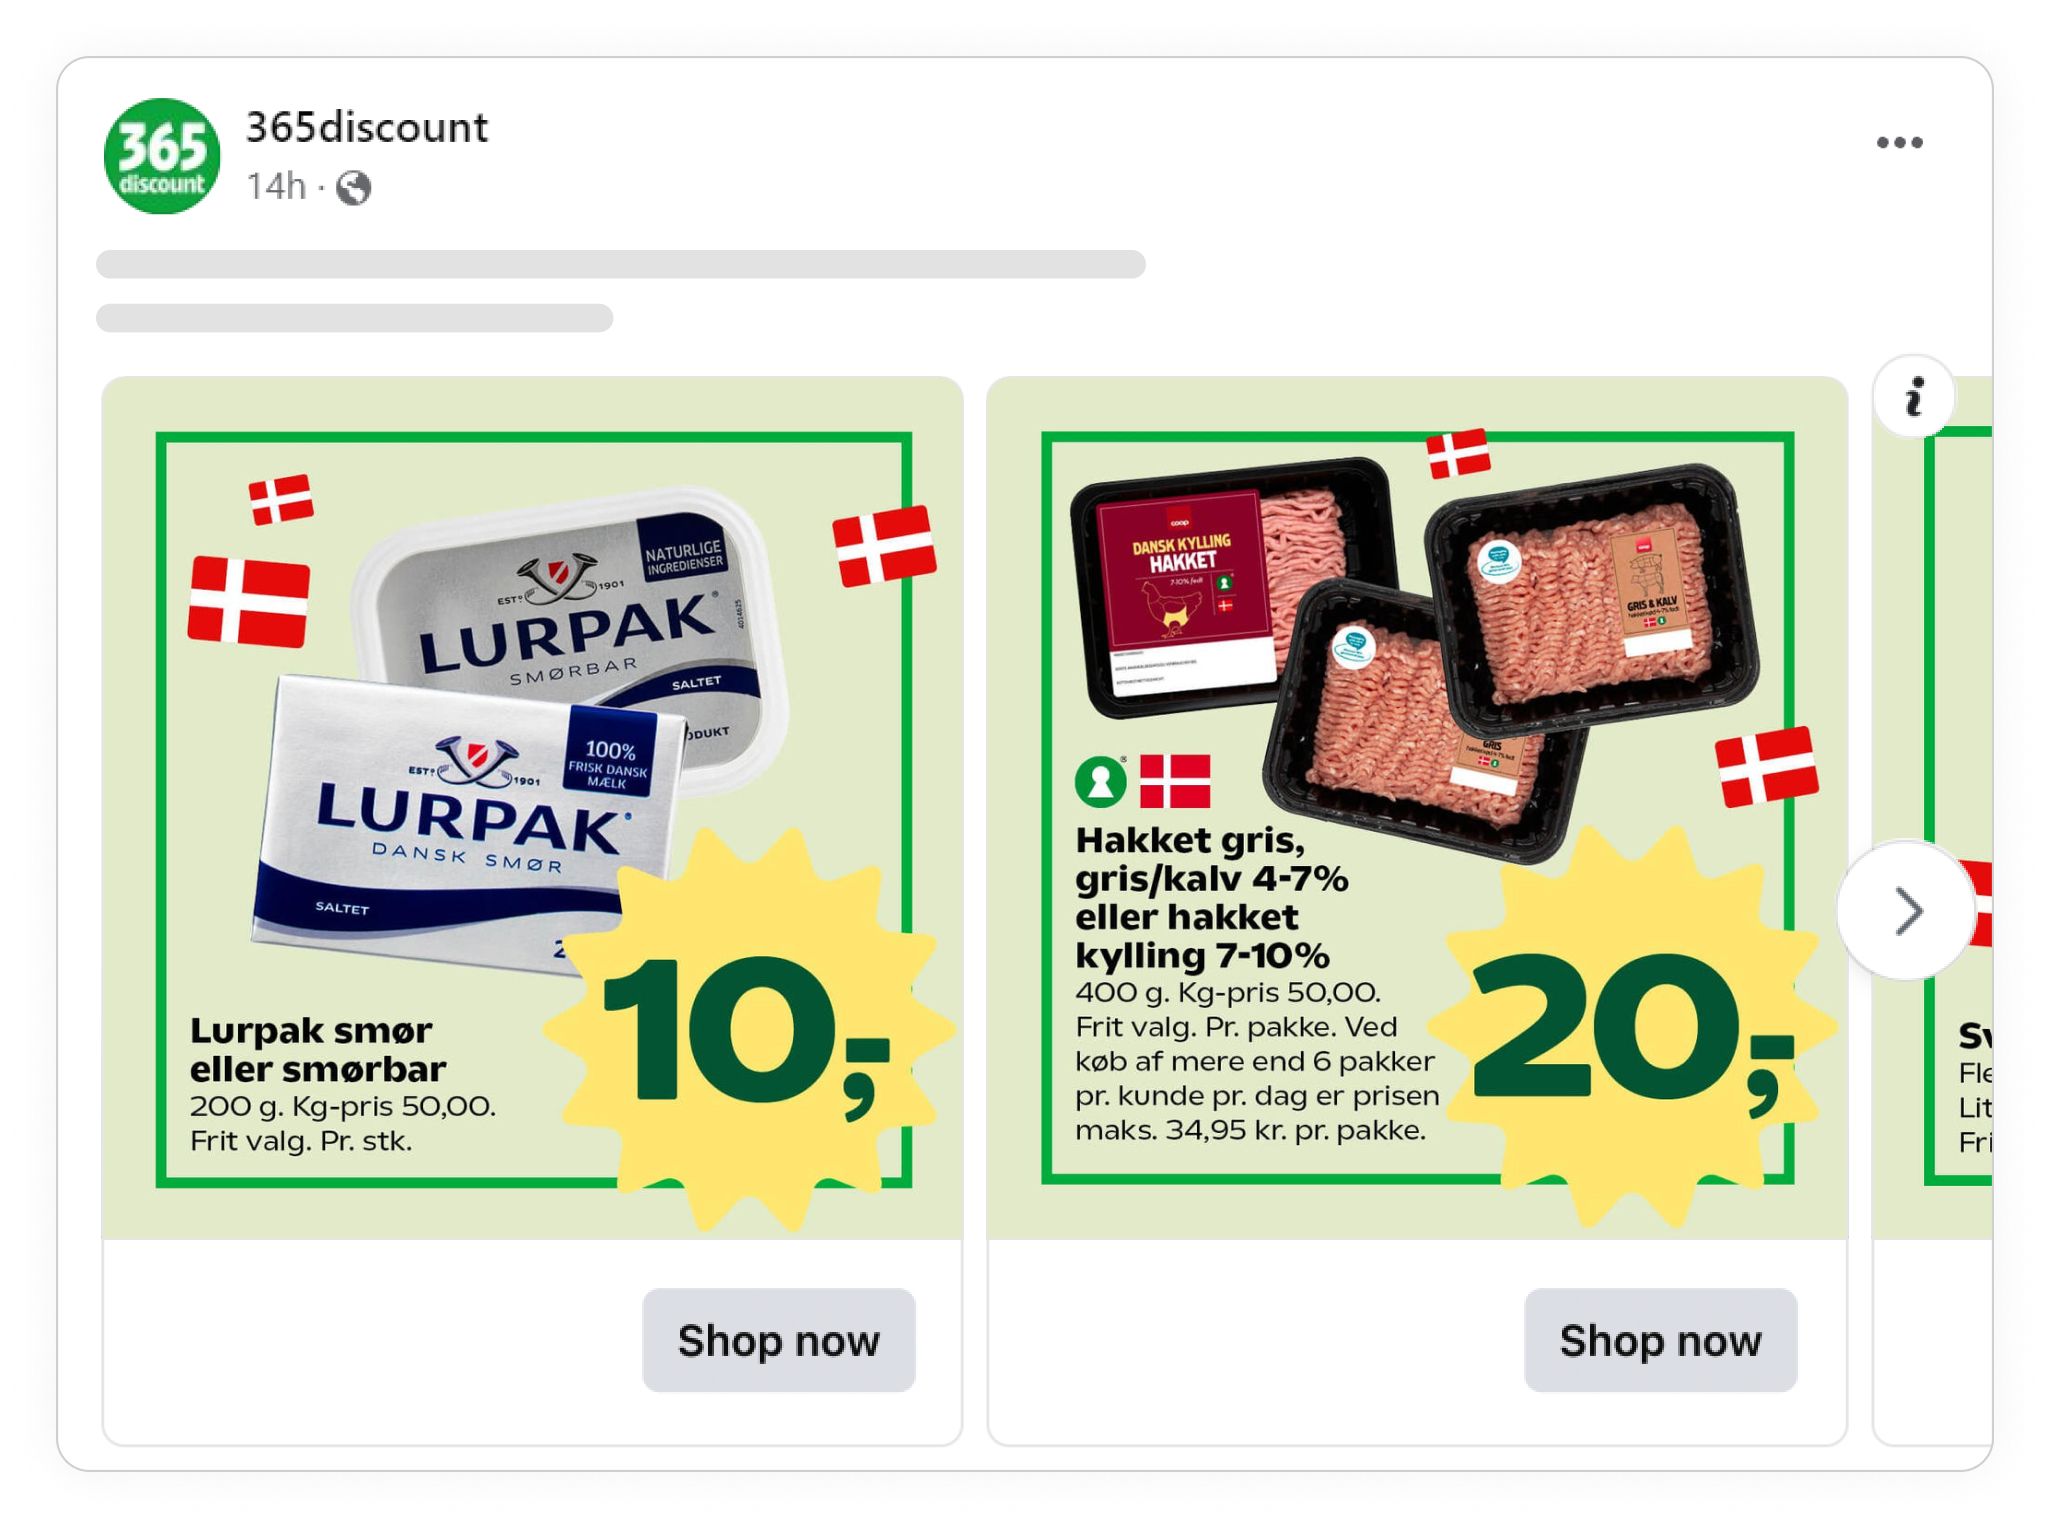
Here is an example of showing price in a Catalog Ad:
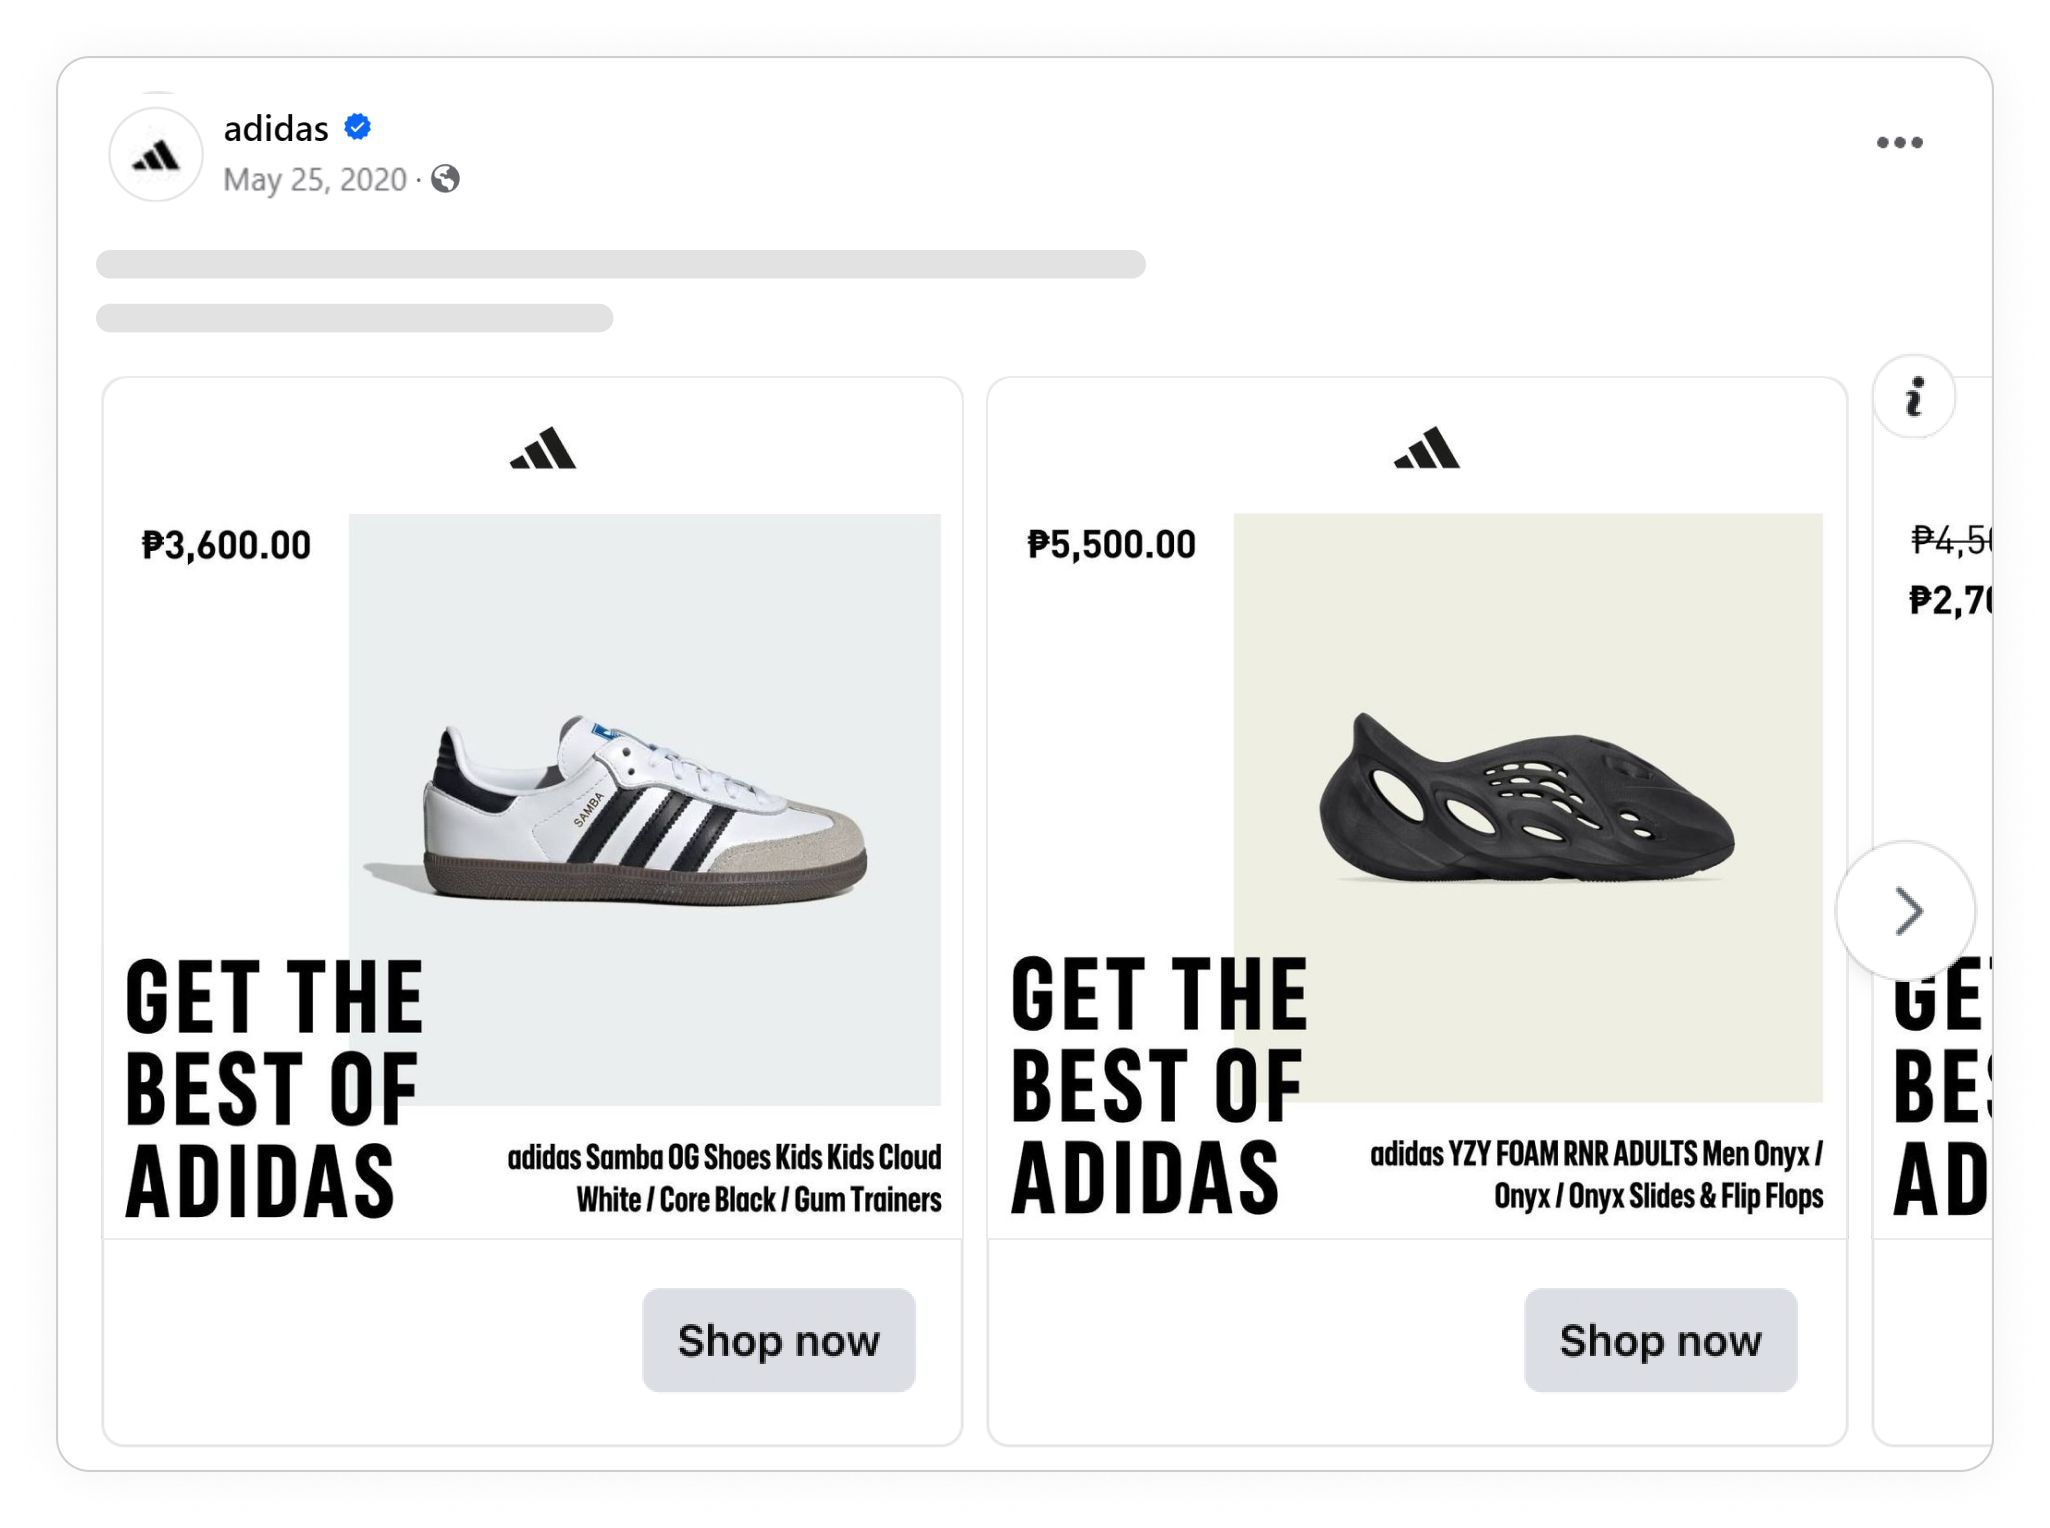
- The ad has the price, but it is not center of focus
- It is stylish
- It promotes other than the product "Get the best of adidas"
Showing your Logo in Catalog Ads
Showing your logo in Catalog Ads typically doesn't improve the performance, but we do see some small changes to this based on your audience. The further down in your funnel you are, the more your logo will typically help close the sale.
- Top-funnel ads, on average, don't see improvements in Return on Ad Spend when showing your logo
- Bottom-funnel ads see a +14% improvement in Return on Ad Spend when showing your logo
You can see more about showing your logo in Catalog Ads here.
Here's how showing your logo on average influence Catalog Ads:
Return On Ad Spend
-0%
Cost Per Purchase
-1%
Click Through Rate
-2%
Cost Per Click
-3%
Conversion Rate
-24%
Usage
37%
These numbers show how Catalog Ads showing the logo of the advertiser perform on average compared to Catalog Ads not showing the logo.
Remember that these are average numbers. For some brands, their logo perform better, and for other brands, their logo perform worse.
- Very dominent fous on the logo
- Tilted to stand out in the feed
- Very distinct model images - very unique style
Showing On-sale designs in your Catalog Ads
Even though sales more often than not will perform better, then sales are especially effective in your bottom funnel and retargeting - making consumers that already know about you very likely to buy.
The more bottom-funnel your ad is, the better a sale will work.
- Top-funnel ads see a +39% improvement in Return on Ad Spend when showing on-sale designs
- Bottom-funnel ads see a +68% improvement in Return on Ad Spend when showing on-sale designs
You can see a ton of examples of sales Catalog Ads here, learn more about showing discounts in your Catalog Ads here, and learn more about campaigns in your Catalog Ads here.
Here's how showing on-sale designs on average influence Catalog Ads:
Return On Ad Spend
+39%
Cost Per Purchase
-14%
Click Through Rate
-9%
Cost Per Click
-24%
Conversion Rate
-20%
Usage
35%
These numbers show how Catalog Ads showing on-sale designs perform on average compared to Catalog Ads not showing on-sale designs.
Remember that these are average numbers. For some brands, on-sale designs perform better, and for other brands, on-sale designs perform worse.
- The sale percentage is focused
- The ad is very stylish, not just product image but the product on a pedestal
- A lot of information (logo, name, short description) which is important when targeting new audiences.
Showing Product Names in your Catalog Ads
Here's how showing product names on average influence Catalog Ads:
Return On Ad Spend
+1%
Cost Per Purchase
+7%
Click Through Rate
-6%
Cost Per Click
+2%
Conversion Rate
+2%
Usage
33%
These numbers show how Catalog Ads showing product names perform on average compared to Catalog Ads not showing product names.
Remember that these are average numbers. For some brands, product names perform better, and for other brands, product names perform worse.
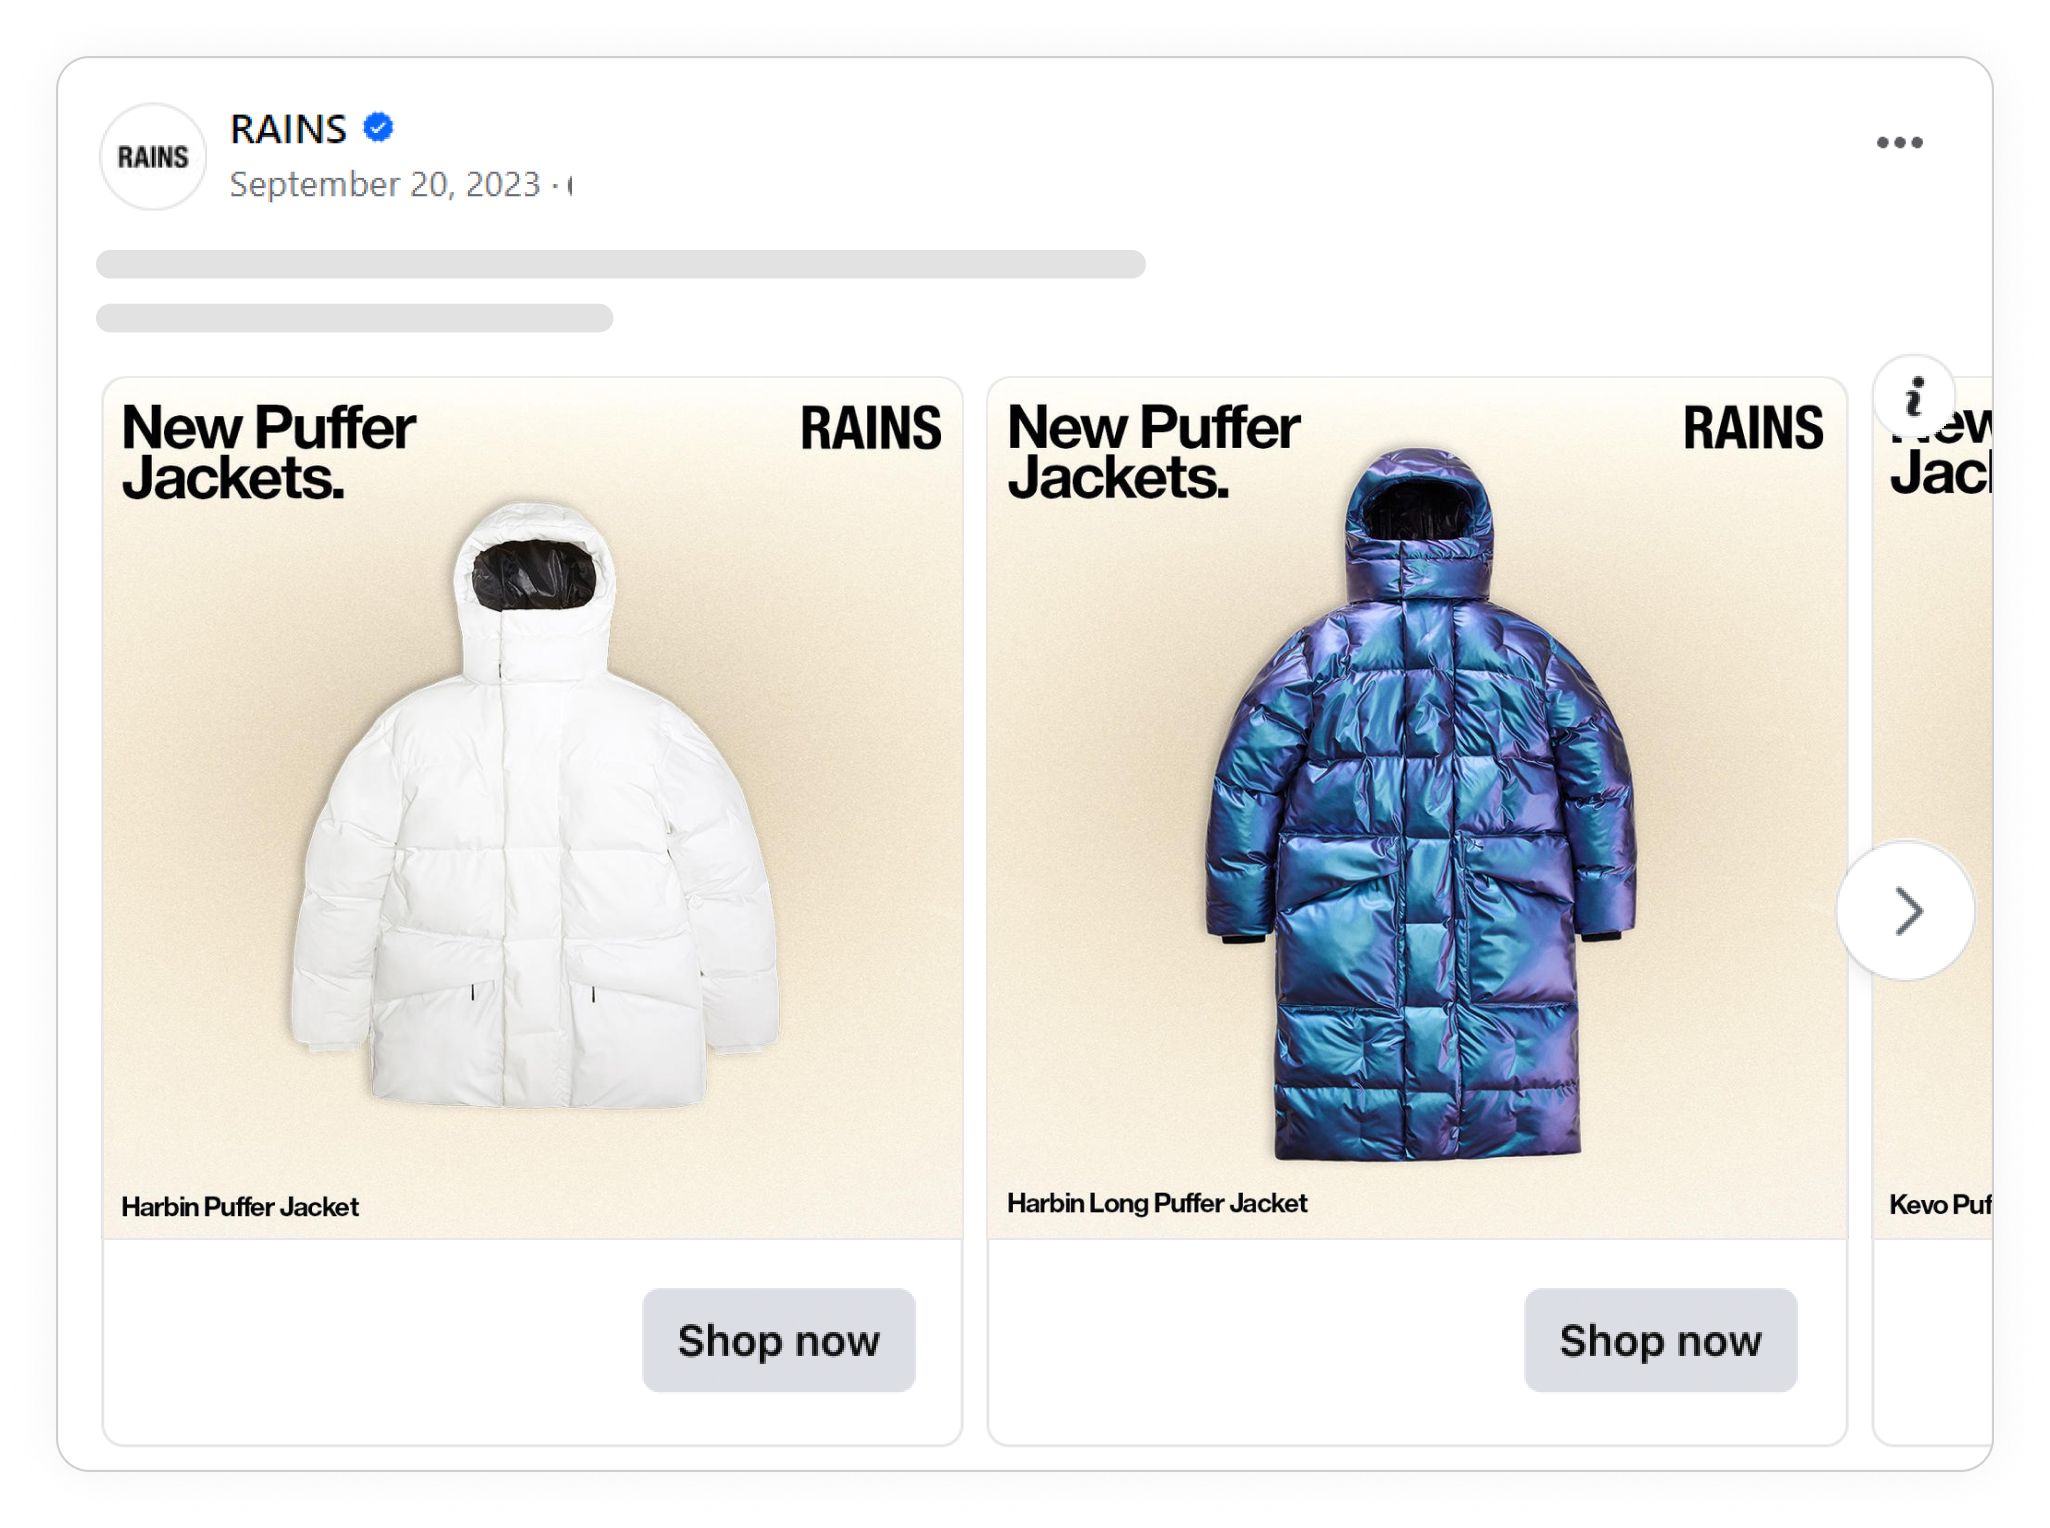
- Product name is there, but not in focus. It is never going to be the "selling" information but more of a need to have for people to find the product later. Putting it in the corner makes it possible for RAINS to promote other features while still enabling people to find the product later
- Very stylish Catalog Ad design - nice focus ring around the product
- Includes product information such as category and logo/brand name.
Showing Original prices in your Catalog Ads
Here's how showing original prices on average influence Catalog Ads:
Return On Ad Spend
+19%
Cost Per Purchase
-14%
Click Through Rate
-13%
Cost Per Click
-24%
Conversion Rate
-32%
Usage
25%
These numbers show how Catalog Ads showing original prices perform on average compared to Catalog Ads not showing original prices.
Remember that these are average numbers. For some brands, original prices perform better, and for other brands, original prices perform worse.
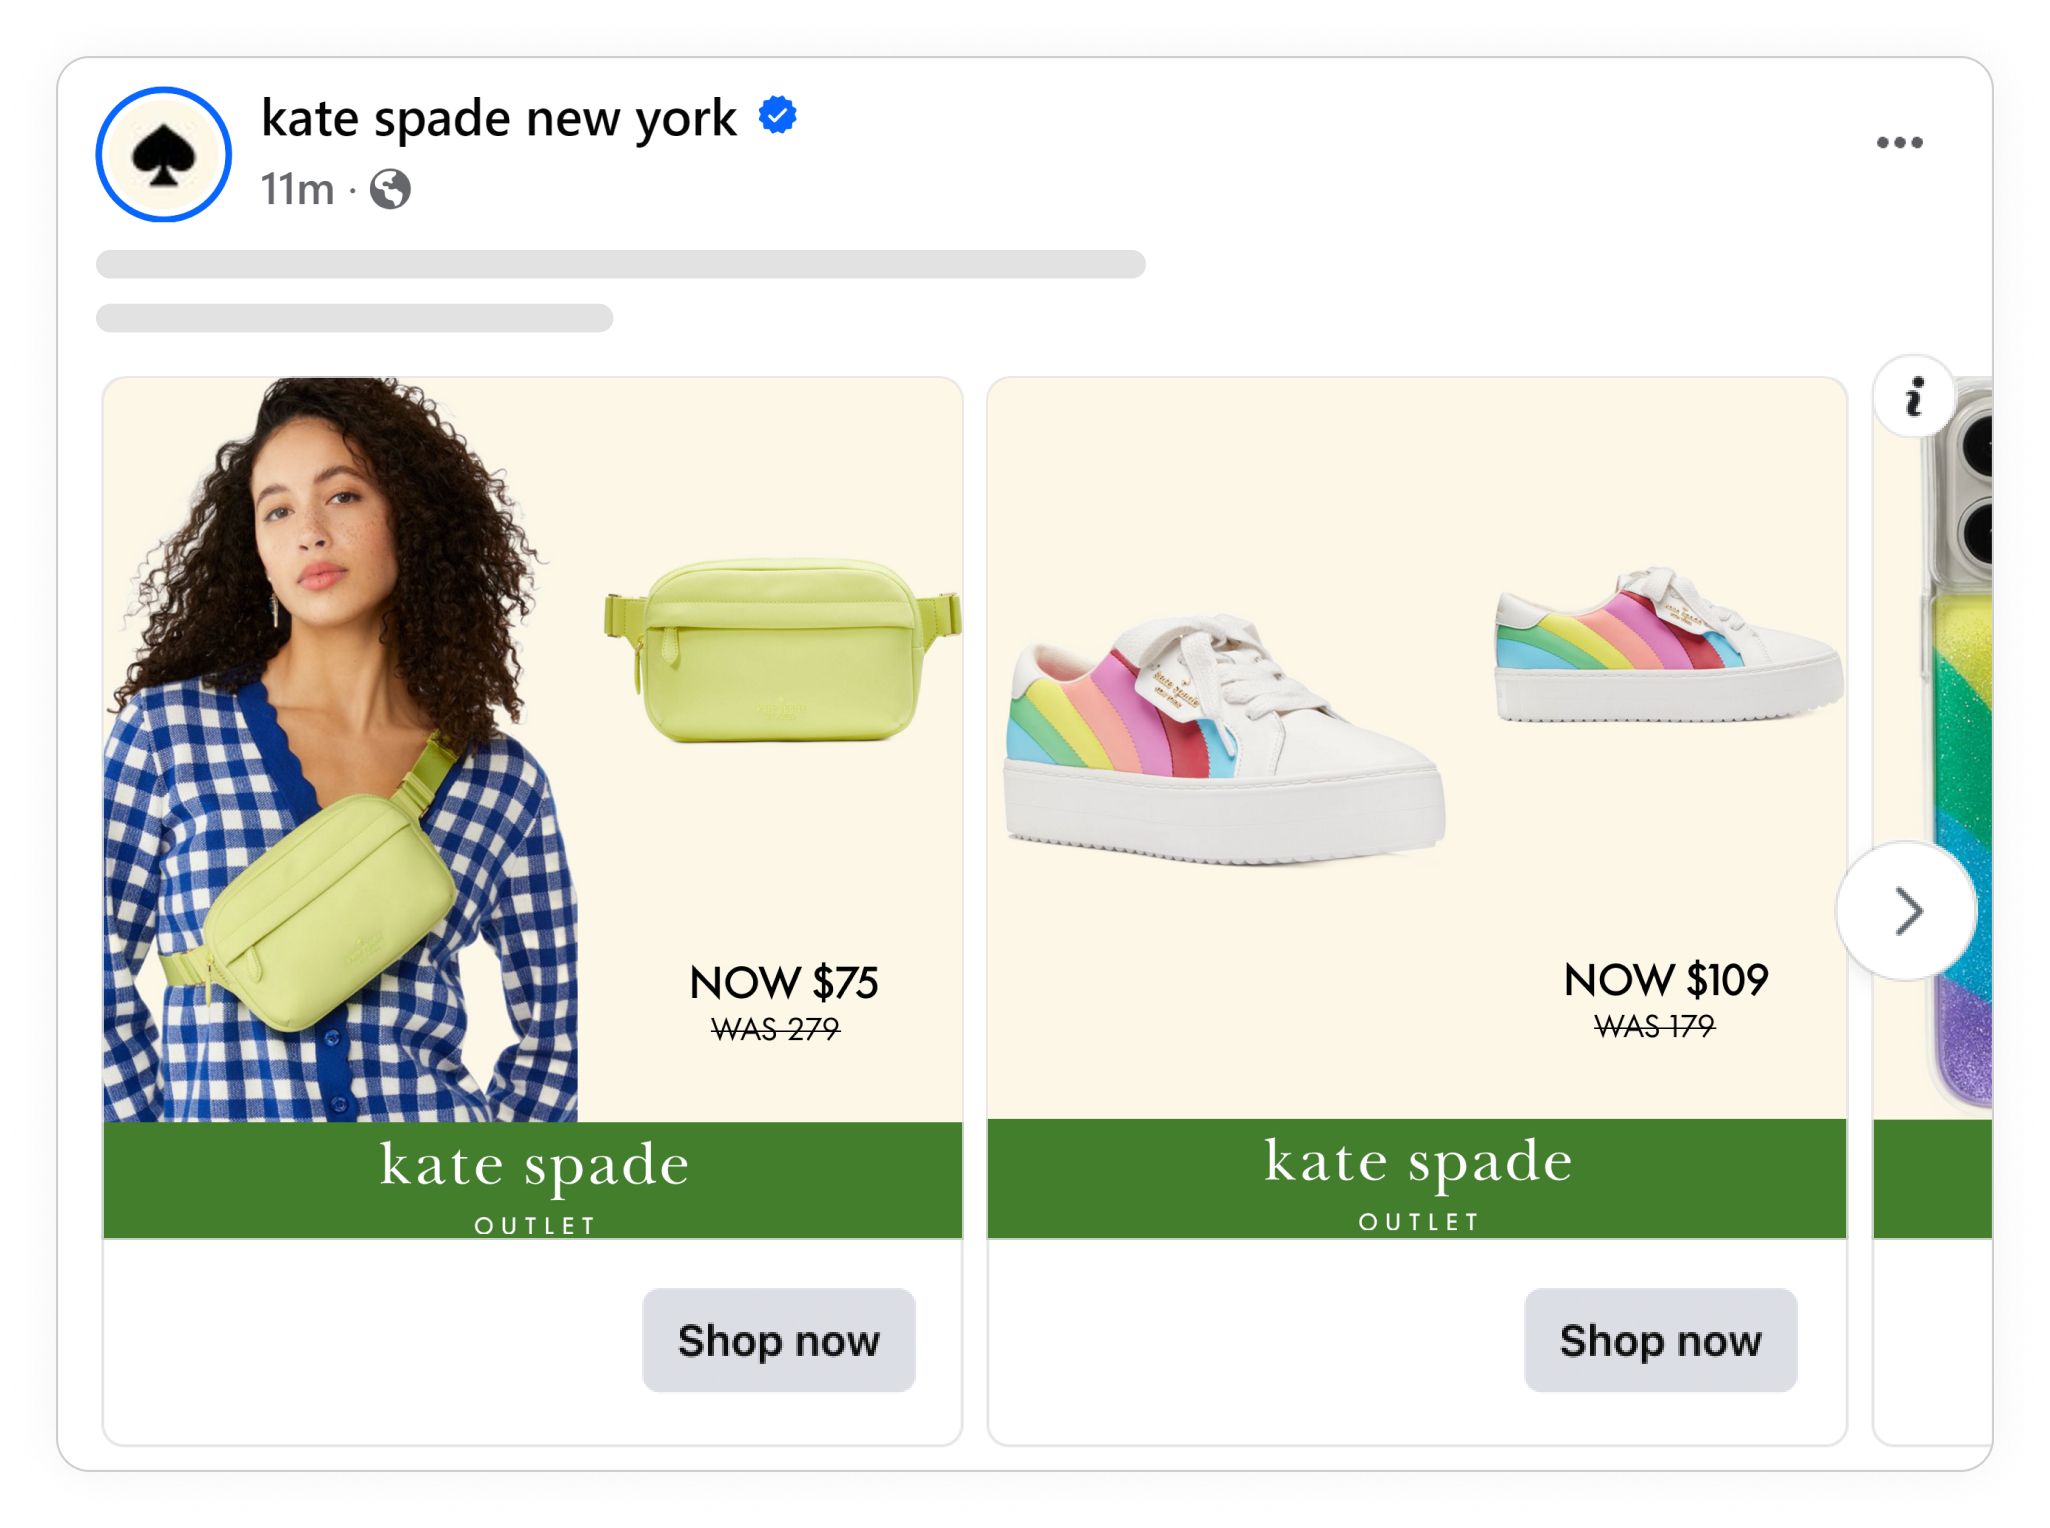
- There is a nice focus on "NOW $75" while also having the striked out before price so you can easily see the huge savings
- The ad still works as an upper funnel ad as it is designed very stylish designed
- It also has more images of the product both product image and the image in context on a model
Showing additional images in your Catalog Ads
When you introduce your products for consumers for the first time, you should not reveal too much information about the product. Don’t overwhelm a curios consumer with too many details - you can always do this later.
Additional images of the product is adding more details, in a visual way - and what we see, is that the lower in your funnel the consumer is, the better additional images work.
- Top-funnel ads see a +7% improvement in Return on Ad Spend when showing additional images
- Bottom-funnel ads see a +33% improvement in Return on Ad Spend when showing additional images
You can learn more about showing additional images in your Catalog Ads here.
Here's how showing additional images on average influence Catalog Ads:
Return On Ad Spend
+7%
Cost Per Purchase
+25%
Click Through Rate
+3%
Cost Per Click
+7%
Conversion Rate
-12%
Usage
20%
These numbers show how Catalog Ads showing additional images perform on average compared to Catalog Ads not showing additional images.
Remember that these are average numbers. For some brands, additional images perform better, and for other brands, additional images perform worse.

- Very impressive model photos - works very well for upper funnel
- Additional images showing everything from full model, to product, to backshot
- Logo in focus, so it is clear what the brand is considering we are targeting new people
Showing Savings and Discounts in your Catalog Ads
Here's how showing savings on average influence Catalog Ads:
Return On Ad Spend
+88%
Cost Per Purchase
-14%
Click Through Rate
-13%
Cost Per Click
-31%
Conversion Rate
-12%
Usage
17%
These numbers show how Catalog Ads showing savings perform on average compared to Catalog Ads not showing savings.
Remember that these are average numbers. For some brands, savings perform better, and for other brands, savings perform worse.
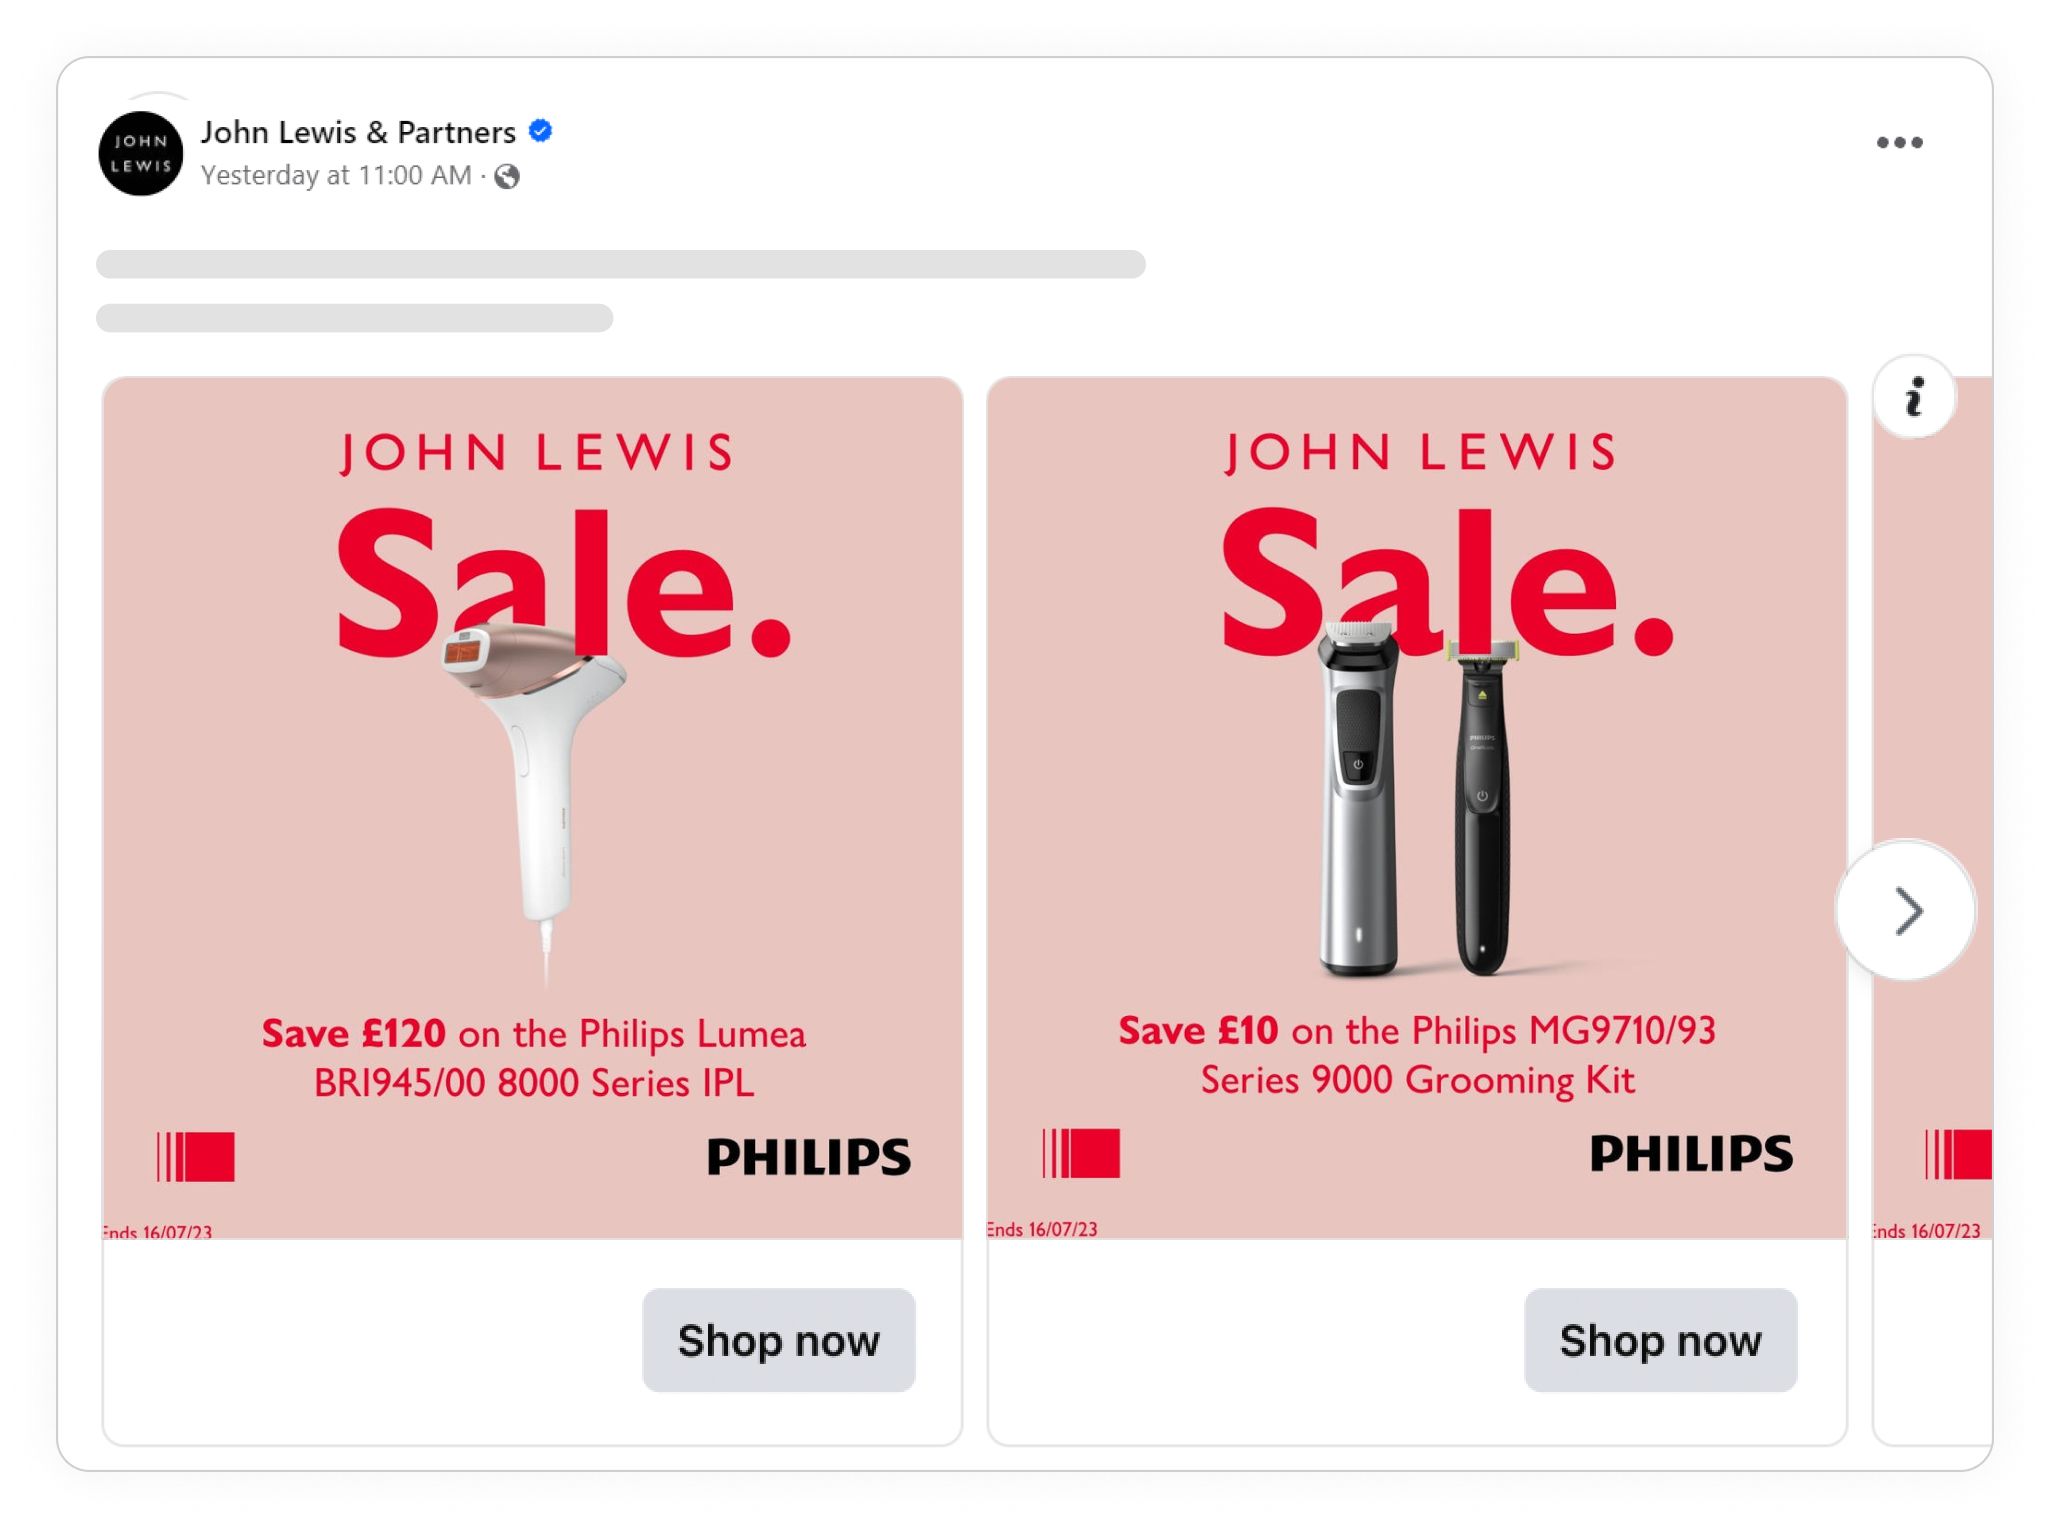
- Very impressive use of background splash of "sale" with having the product standout and cover some the splash - all while staying very stylish
- Has the savings in bold
- Have enough extra information like store name, brand name, product name and product description
Showing Dates in your Catalog Ads
Here's how showing dates on average influence Catalog Ads:
Return On Ad Spend
+27%
Cost Per Purchase
-11%
Click Through Rate
+7%
Cost Per Click
+10%
Conversion Rate
-17%
Usage
21%
These numbers show how Catalog Ads showing dates perform on average compared to Catalog Ads not showing dates.
Remember that these are average numbers. For some brands, dates perform better, and for other brands, dates perform worse.
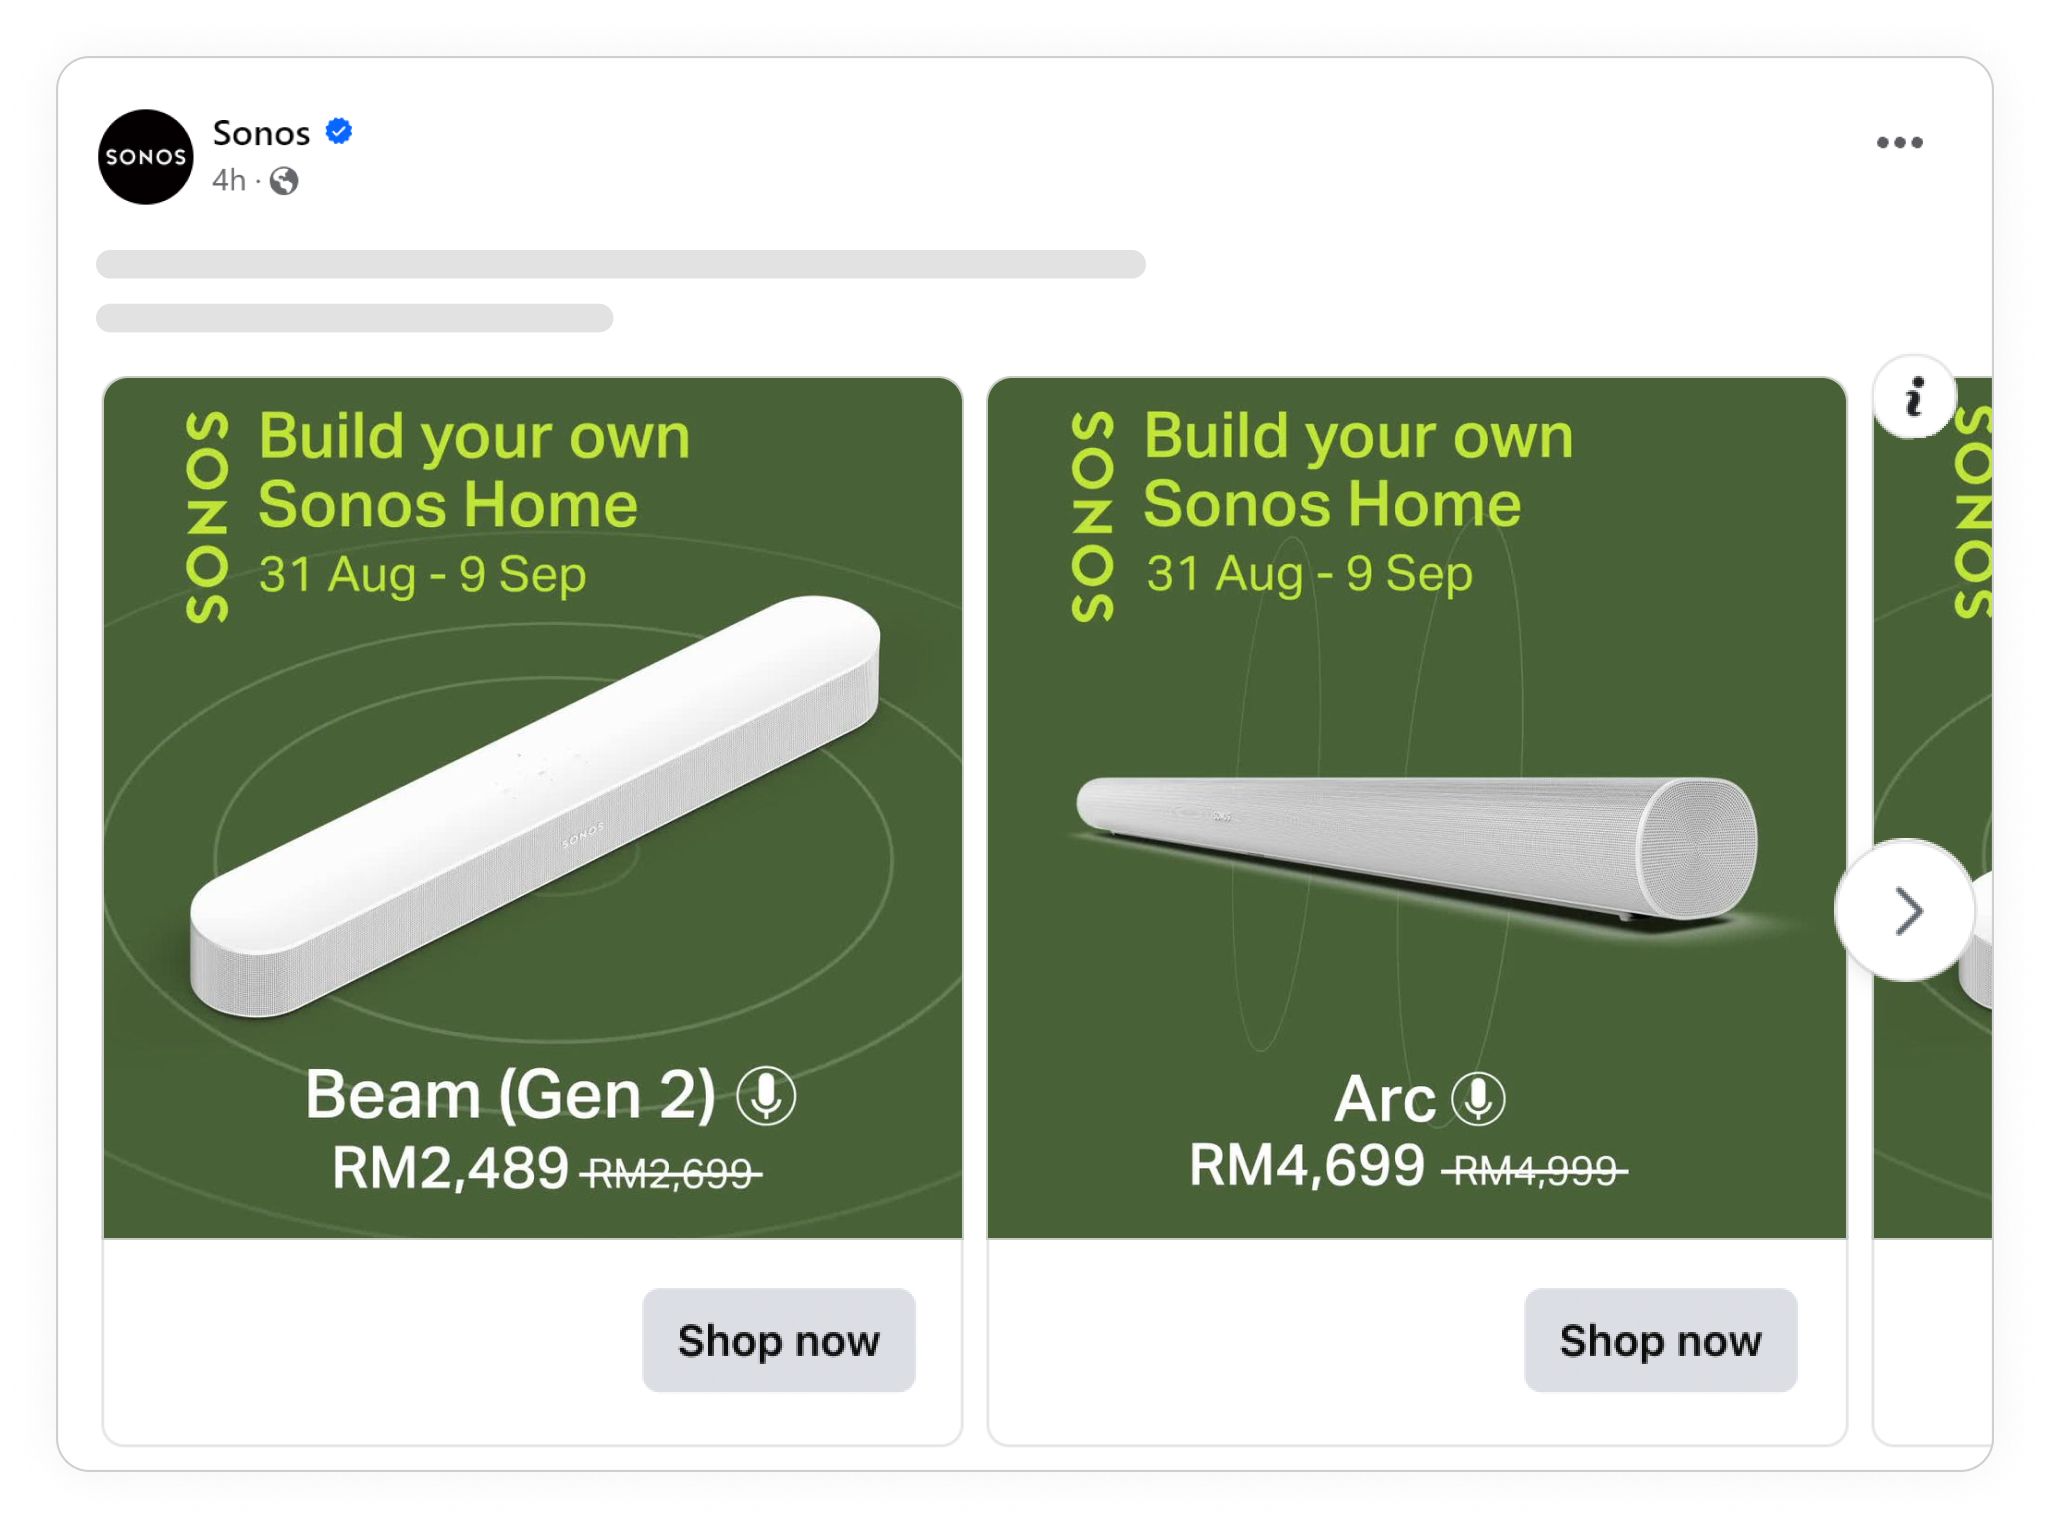
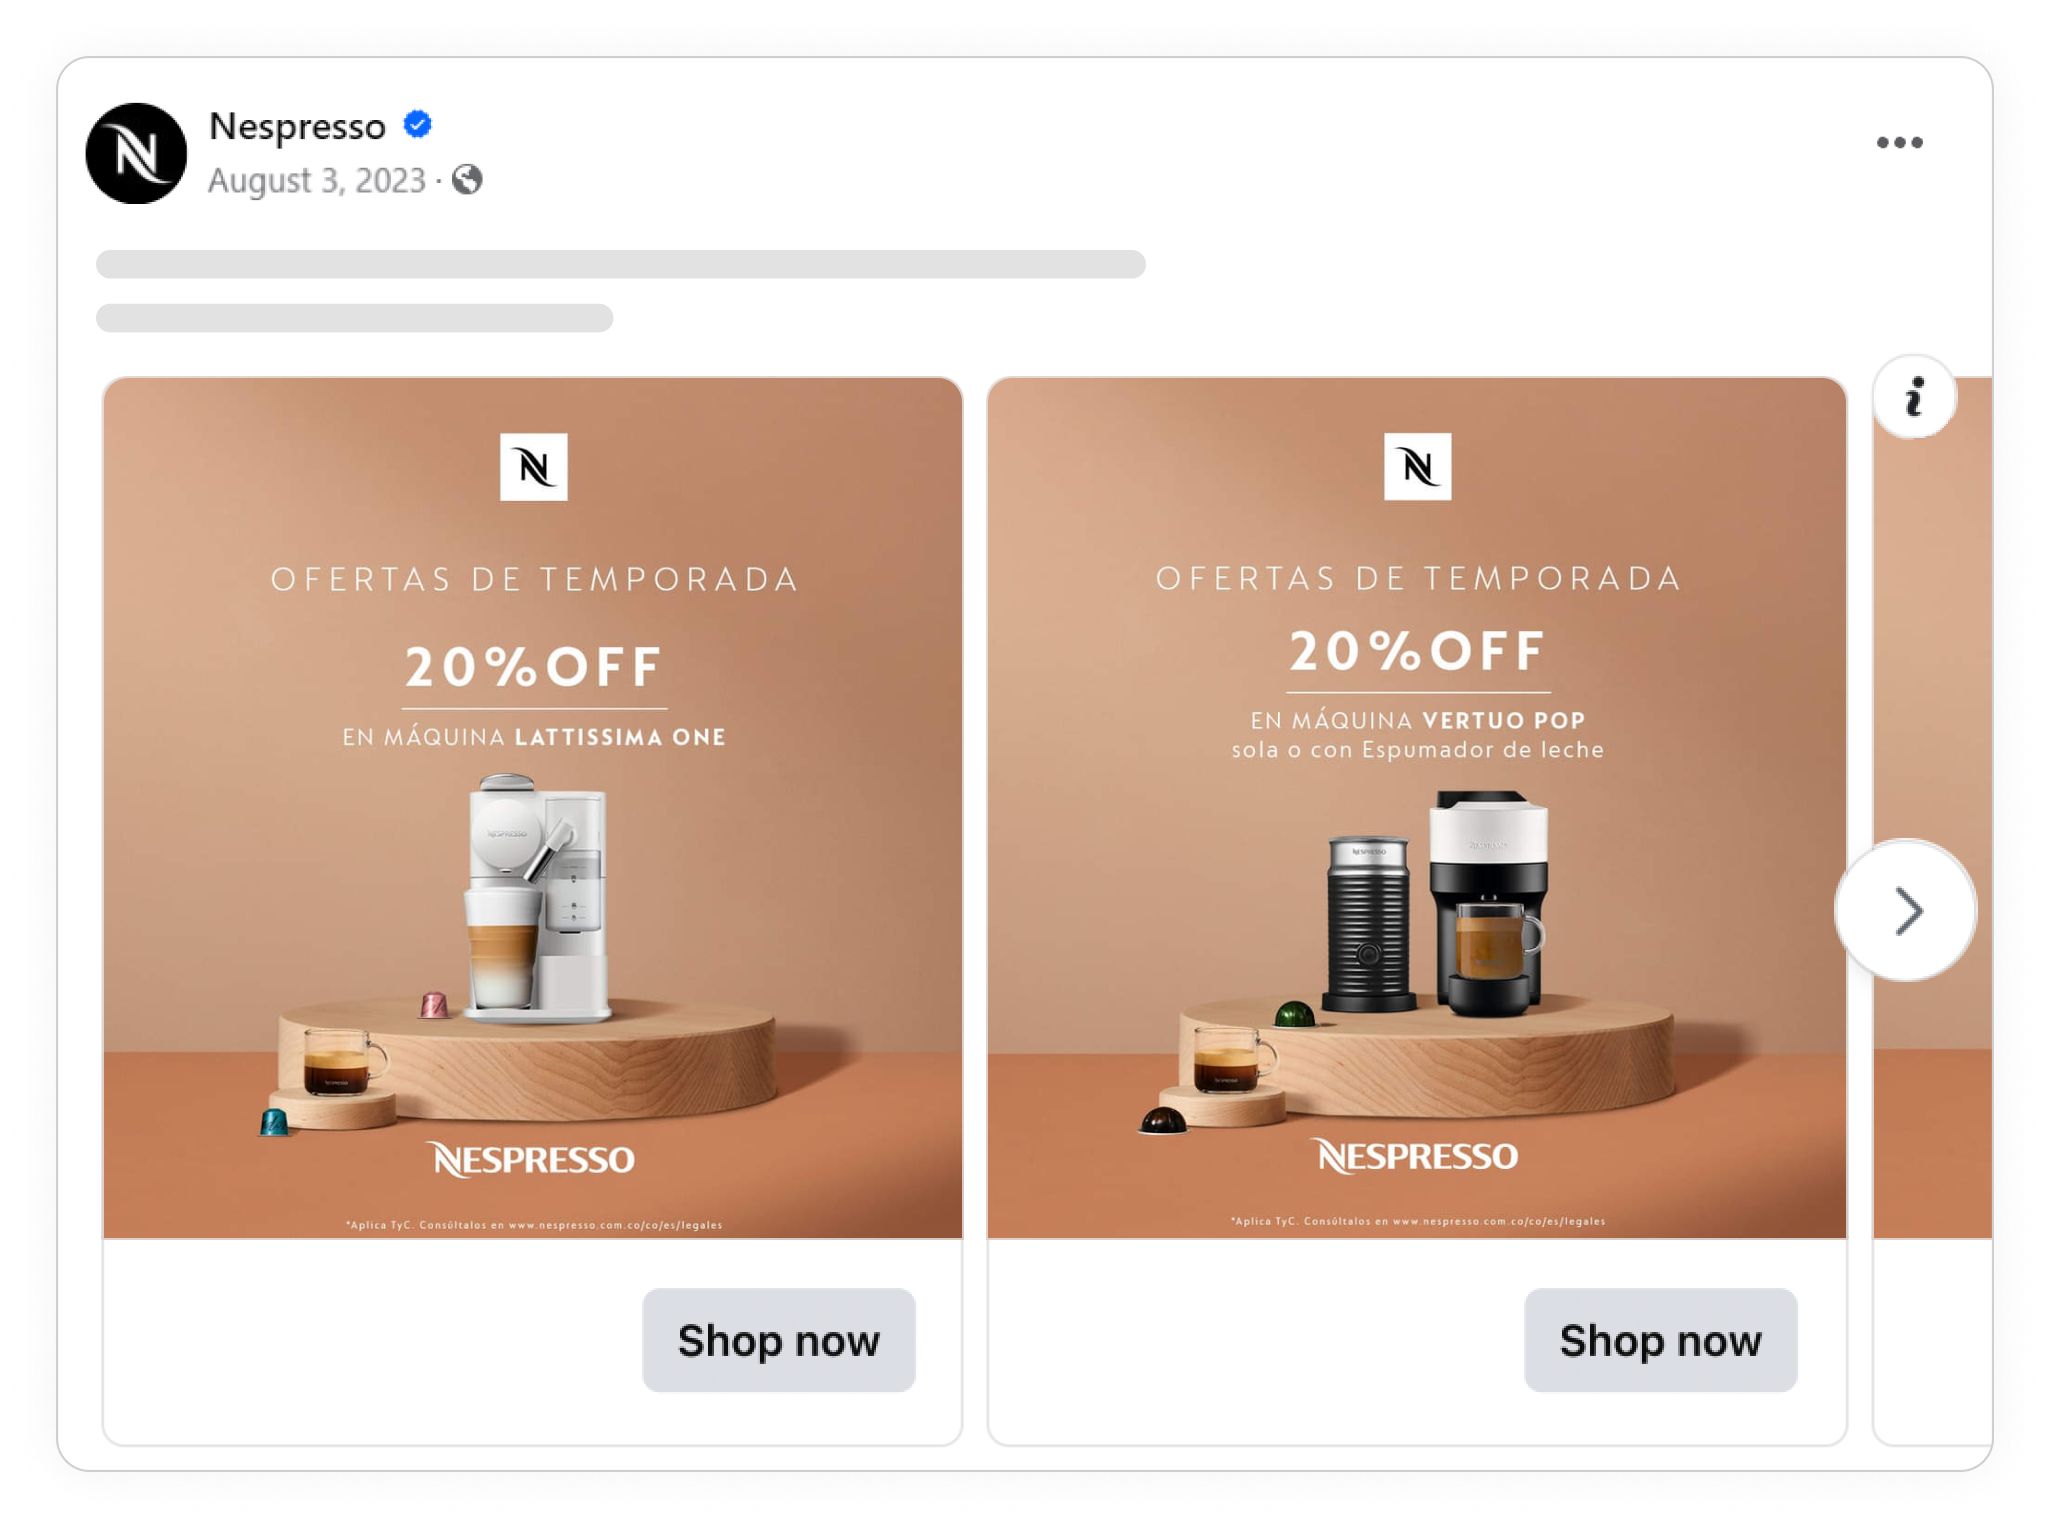
- Very nice use of dates to show the offical promotion period
- Very nice use of splash and product image to create products that stand out in a stylish way - even with a call to acrtion "Build your own Sonos home"
- Very nice use of additional information like brand and product name and sale price
Highlighting News in your Catalog Ads
Here's how highlighting news on average influence Catalog Ads:
Return On Ad Spend
-5%
Cost Per Purchase
+12%
Click Through Rate
-4%
Cost Per Click
-32%
Conversion Rate
-58%
Usage
19%
These numbers show how Catalog Ads highlighting news perform on average compared to Catalog Ads not highlighting news.
Remember that these are average numbers. For some brands, highlighting news perform better, and for other brands, highlighting news perform worse.

- Very nice use of a a "new" splash that is highlighted and draws attention
- Very nice use of high quality model photos
- combined with a solid background color it really stands out in the feed
Showing Shipping info in your Catalog Ads
Here's how showing shipping info on average influence Catalog Ads:
Return On Ad Spend
+5%
Cost Per Purchase
-27%
Click Through Rate
+6%
Cost Per Click
-40%
Conversion Rate
-7%
Usage
13%
These numbers show how Catalog Ads showing shipping information perform on average compared to Catalog Ads not showing shipping information.
Remember that these are average numbers. For some brands, shipping info perform better, and for other brands, shipping info perform worse.
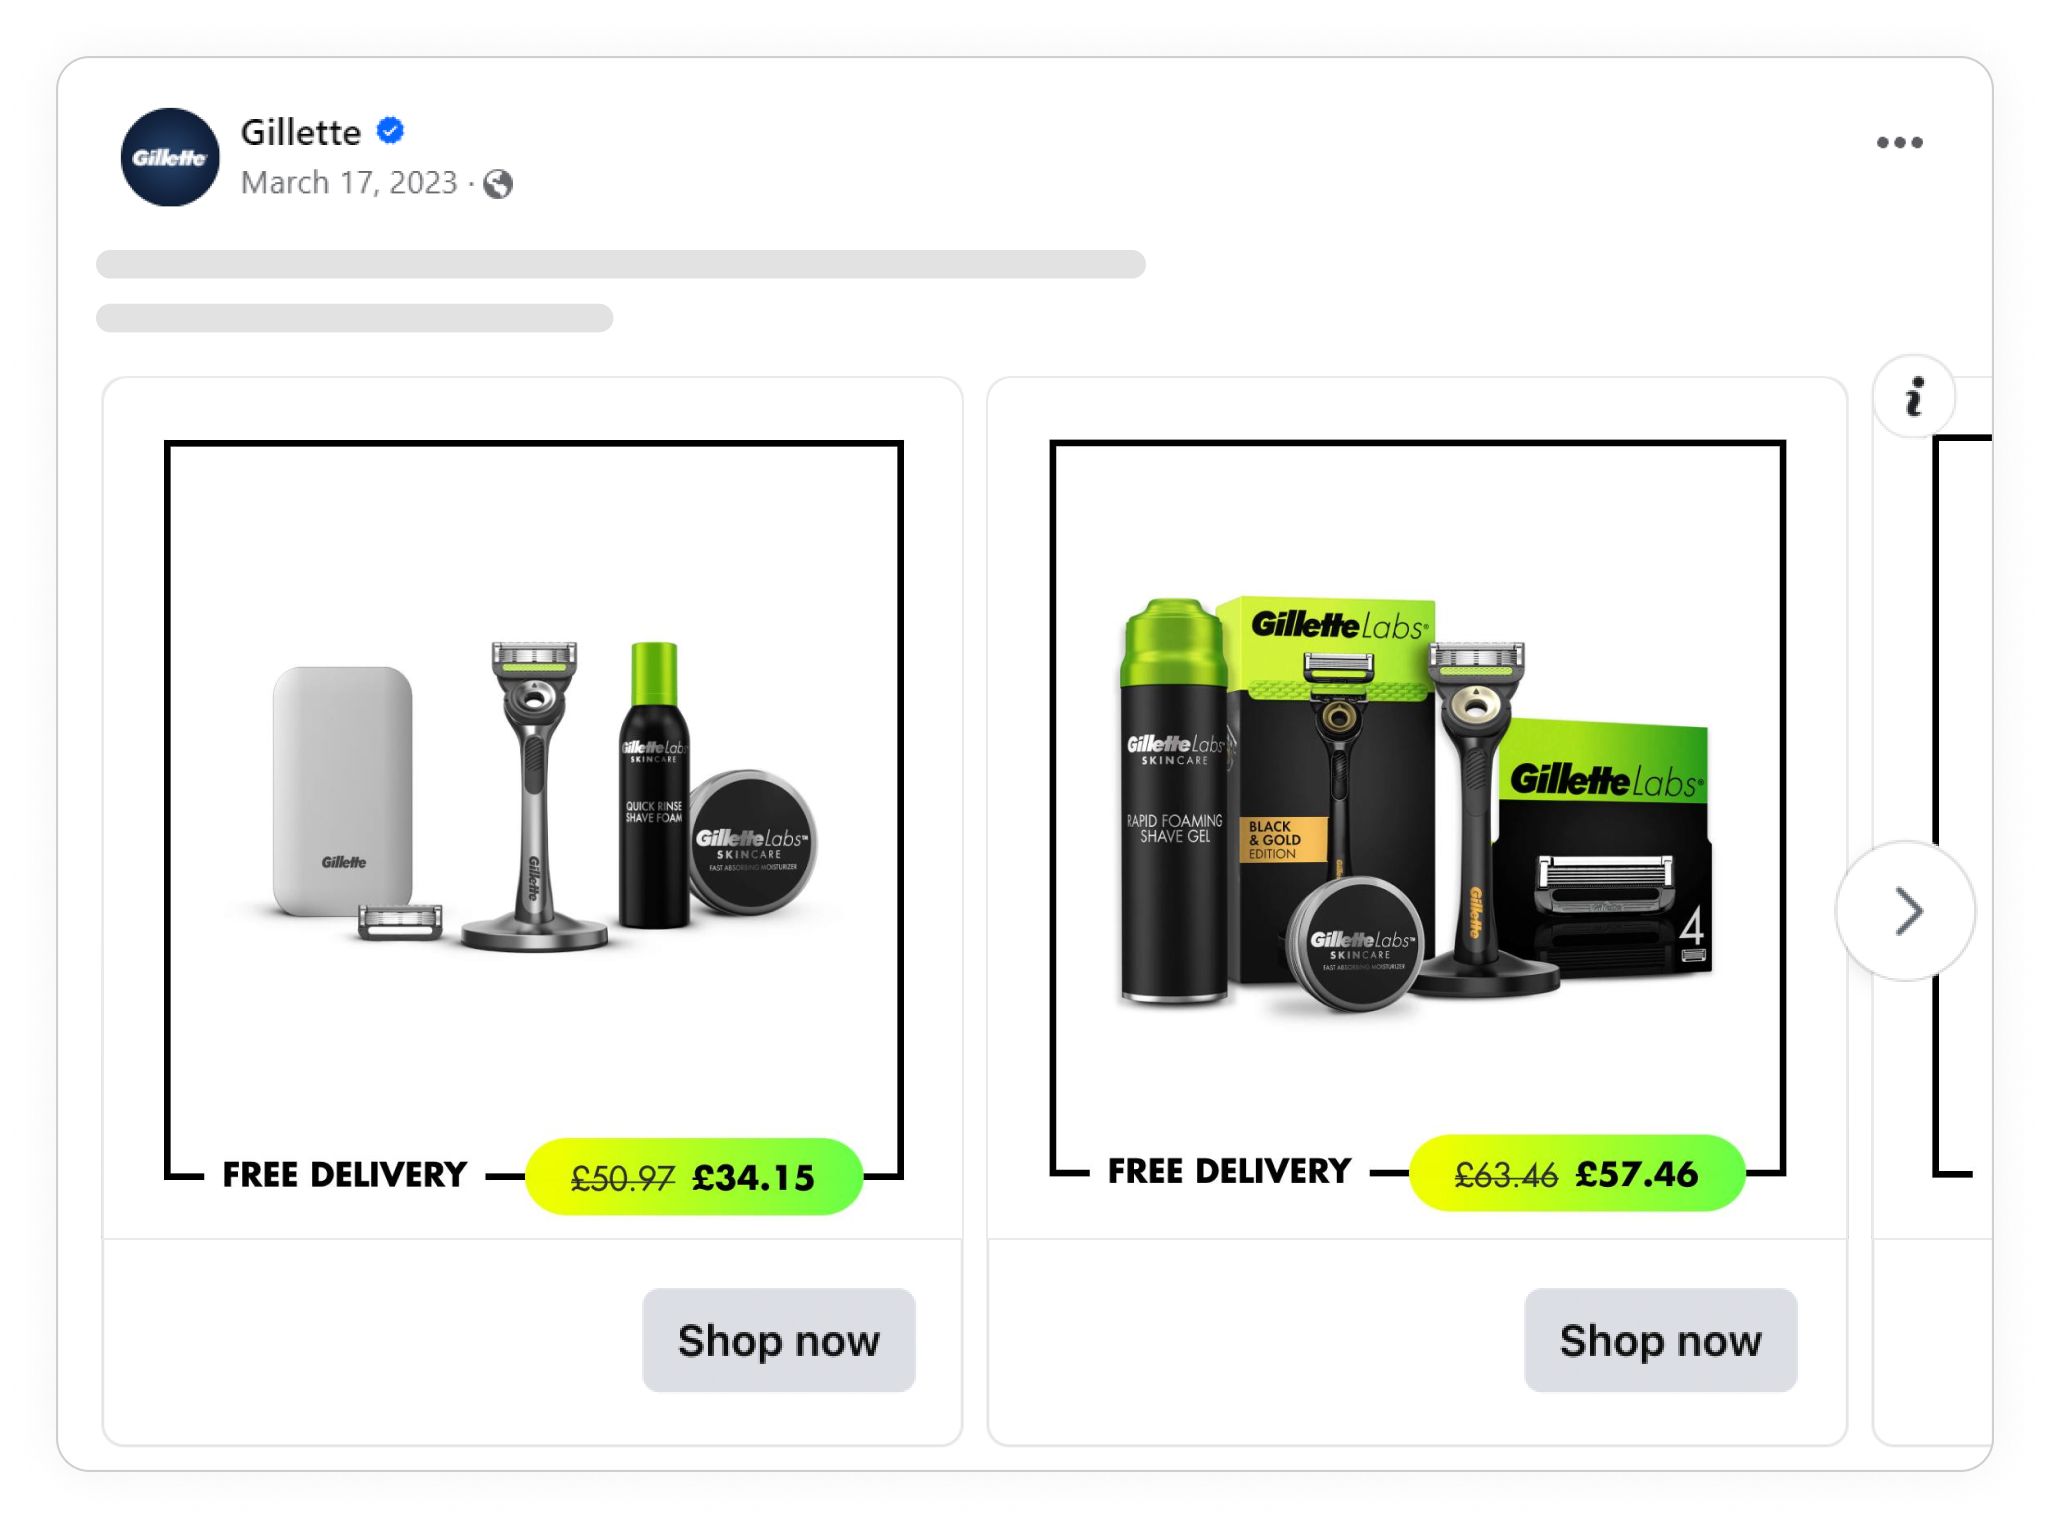
- Very nice use of "free delivery" right next to the price so it is impossible to se
- Very cool use of price splash in the brand colors and containing strikethrough "before" price
- Very nice use of a not just a pack shot but a bundle
Using Product Assets in your Catalog Ads
Here's how showing product assets on average influence Catalog Ads:
Return On Ad Spend
+39%
Cost Per Purchase
-29%
Click Through Rate
-4%
Cost Per Click
+18%
Conversion Rate
+48%
Usage
6%
These numbers show how Catalog Ads showing product assets perform on average compared to Catalog Ads not showing product assets.
Remember that these are average numbers. For some brands, product assets perform better, and for other brands, product assets perform worse.
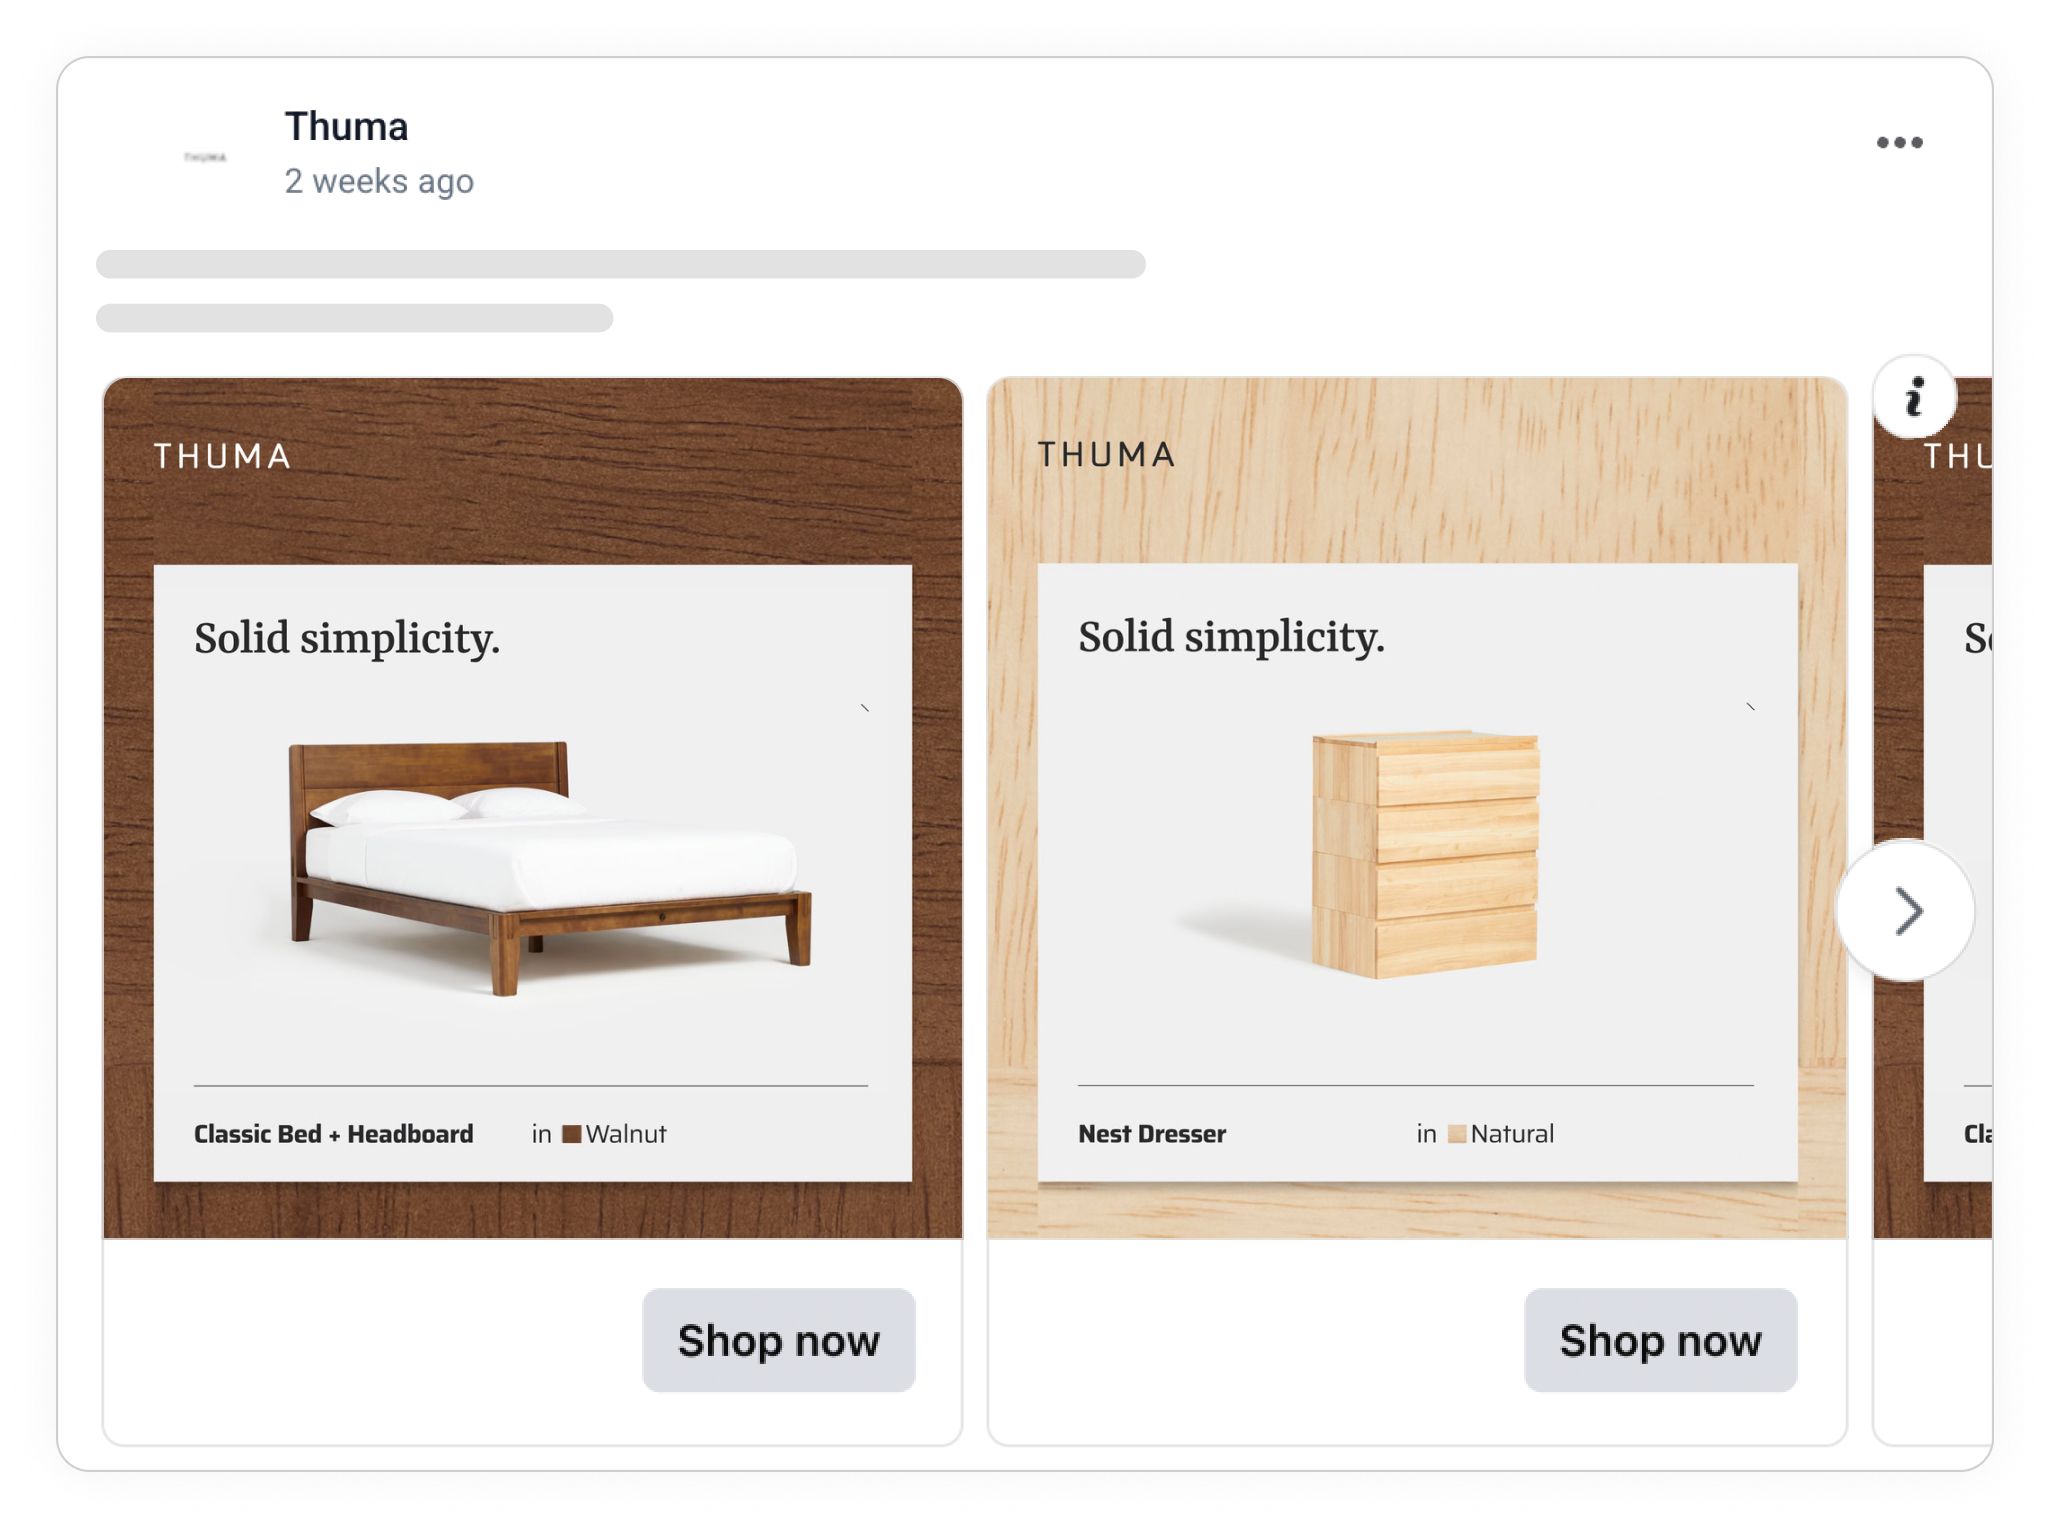
- Very nice use of the product color (an asset of the product) in the design. The whole design is wrapped in that
- Also in the bottom where they write the color name with the box
- It is just such a stylized way of showing off your products and their assets. Very creative!
Showing Social Proof in your Catalog Ads
Social proof is one of the best-known marketing tactics, and it's more often than not effective at making your customers buy.
Especially customers who don't know you or your products find a lot of trust in your social proof - the earlier in your marketing funnel customers are, the more effective Social Proof is.
- Top-funnel ads see a +58% improvement in Return on Ad Spend when showing Social Proof
- Bottom-funnel ads see a +35% improvement in Return on Ad Spend when showing Social Proof
You can learn more about showing ratings and reviews in your Catalog Ads right here.
Here's how showing social proof on average influence Catalog Ads:
Return On Ad Spend
+58%
Cost Per Purchase
-29%
Click Through Rate
-21%
Cost Per Click
-9%
Conversion Rate
+53%
Usage
7%
These numbers show how Catalog Ads showing social proof perform on average compared to Catalog Ads not showing social proof.
Remember that these are average numbers. For some brands, social proof perform better, and for other brands, social proof perform worse.
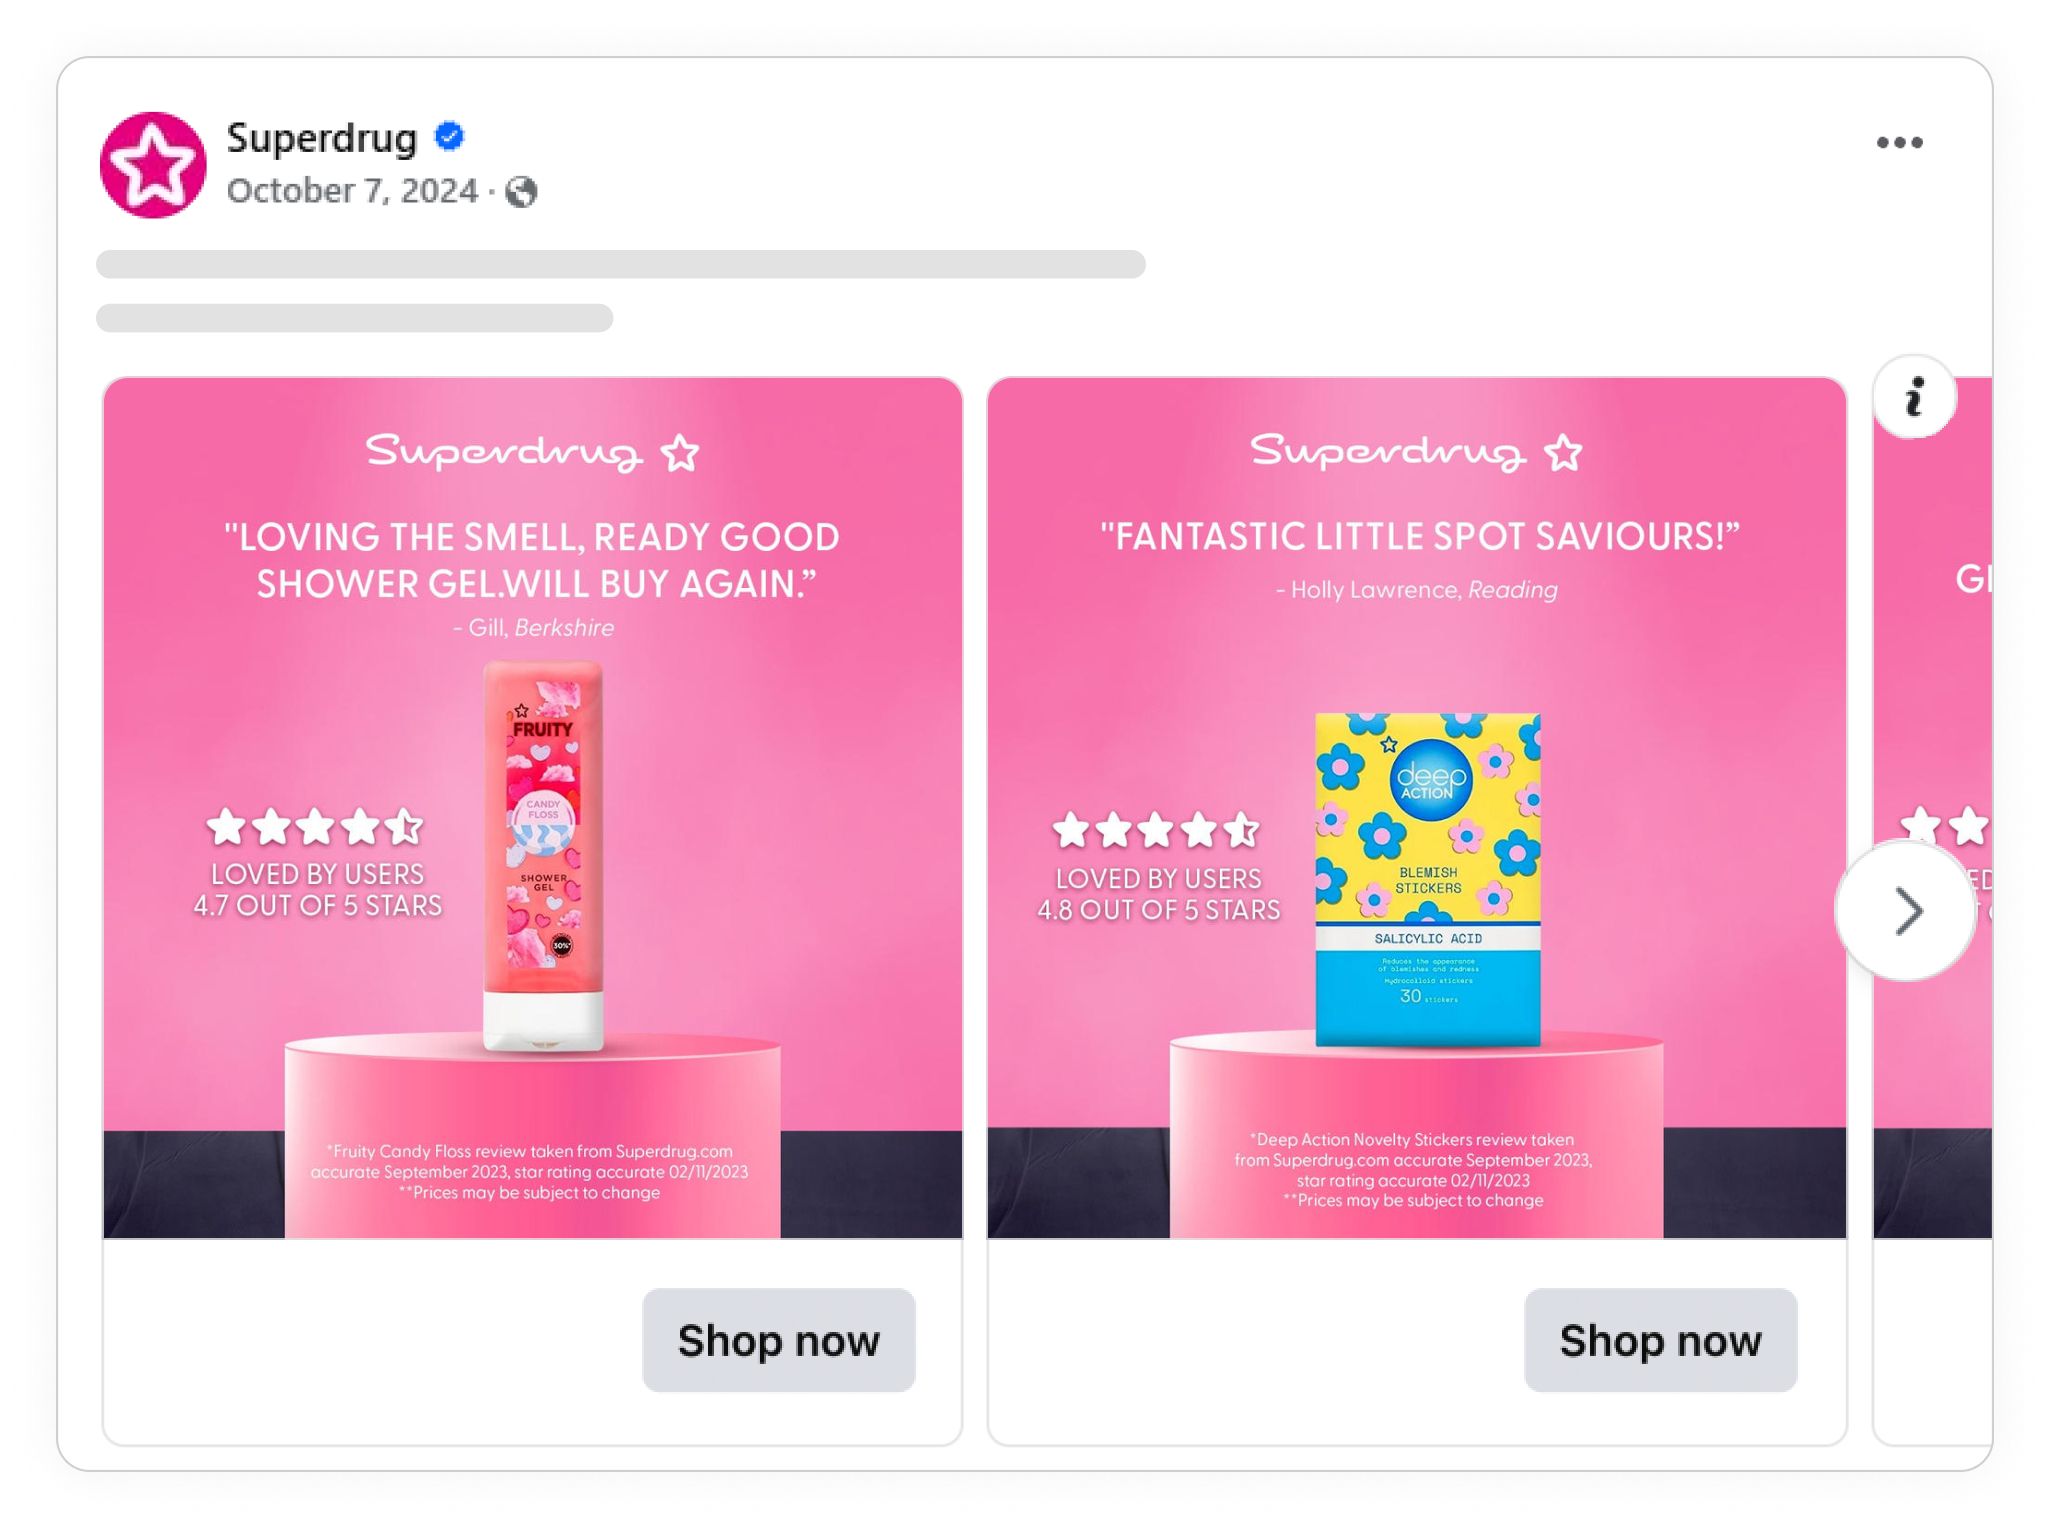
- Very nice design that elevates the product
- Very nice use of quotes to promote the product
- Very nice use of the star stars
Showing Product Brands in your Catalog Ads
Here's how showing brand names on average influence Catalog Ads:
Return On Ad Spend
+31%
Cost Per Purchase
+26%
Click Through Rate
+30%
Cost Per Click
-17%
Conversion Rate
-25%
Usage
6%
These numbers show how Catalog Ads showing brand names perform on average compared to Catalog Ads not showing brand names.
Remember that these are average numbers. For some retailers, brand names perform better, and for other retailers, brand names perform worse.
- Very nice use of the product brand in the top
- Very nice use of multple images
- Very nice usage of color that alligns with the main brand
Showing Custom_labels in your Catalog Ads
The more consumers learn about you and your products, the more nerdy they typically want to become - and we see this very clearly when looking at Custom_labels, the best way to show custom information in Catalog Ads.
The further down you are in your marketing funnel, the better nerdy and custom information will perform.
- Top-funnel ads see a +29% improvement in Return on Ad Spend when showing Custom labels
- Bottom-funnel ads see a +73% improvement in Return on Ad Spend when showing Custom labels
You can learn more about showing custom attributes and features in your Catalog Ads here .
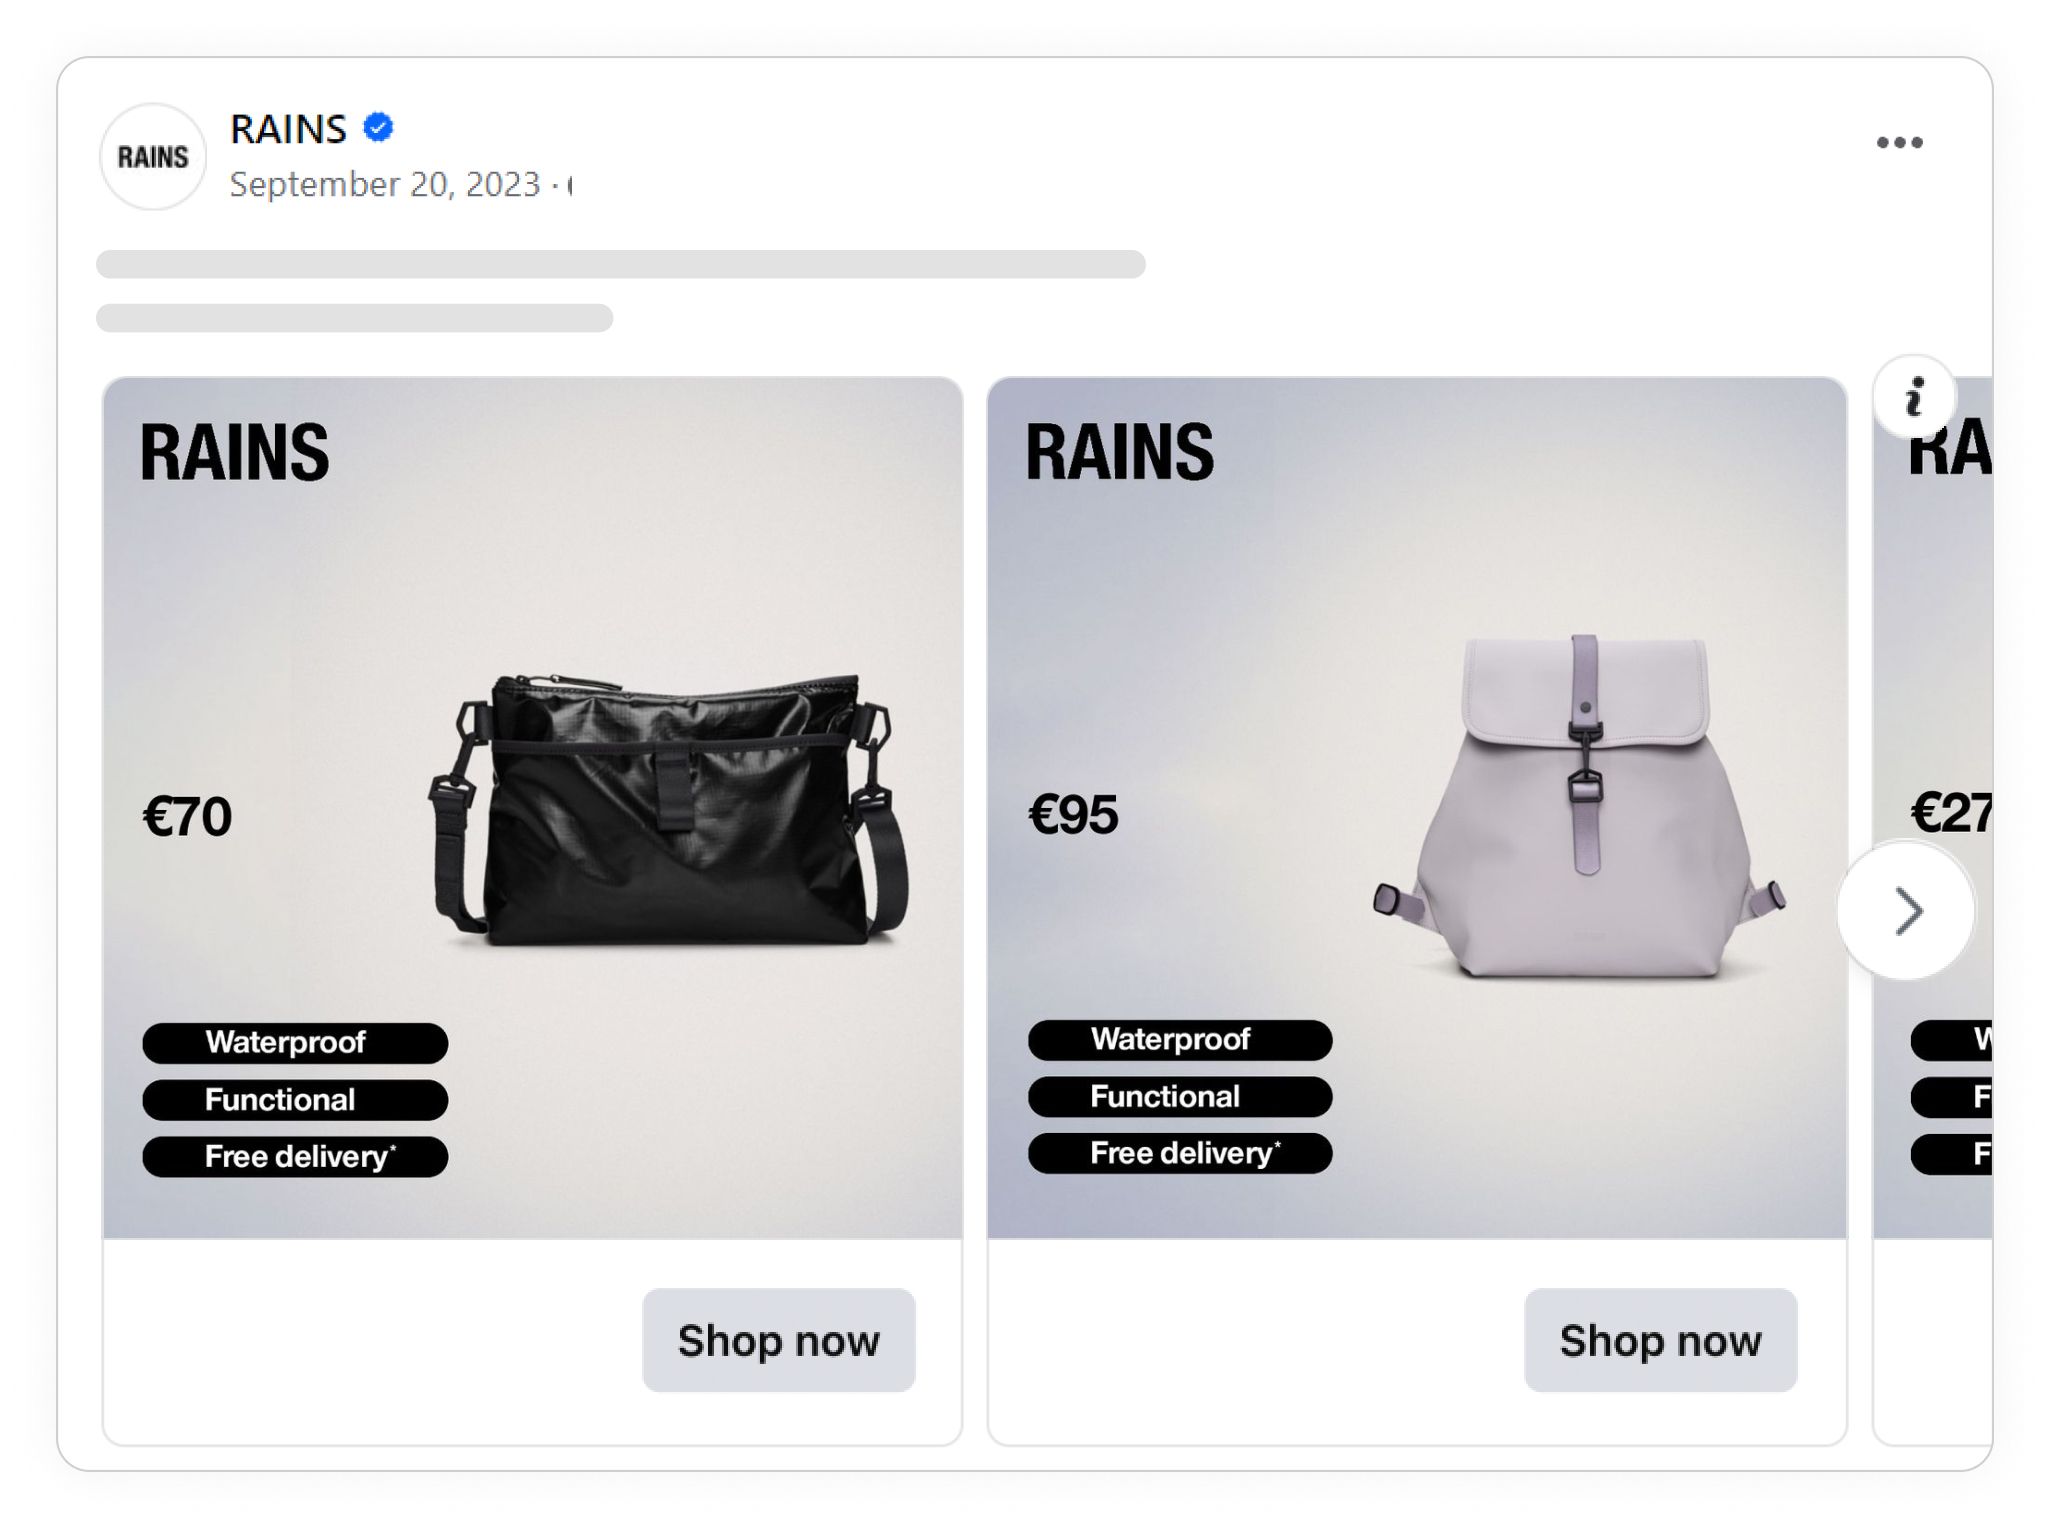
- Very nice use of custom labels to promote core functinoality of the products
- Very nice use of stylized background that draws attention to the product
Here's how showing custom labels on average influence Catalog Ads:
Return On Ad Spend
+29%
Cost Per Purchase
-4%
Click Through Rate
+2%
Cost Per Click
-37%
Conversion Rate
+0%
Usage
9%
These numbers show how Catalog Ads showing custom labels perform on average compared to Catalog Ads not showing custom labels.
Remember that these are average numbers. For some brands, custom labels perform better, and for other brands, custom labels perform worse.
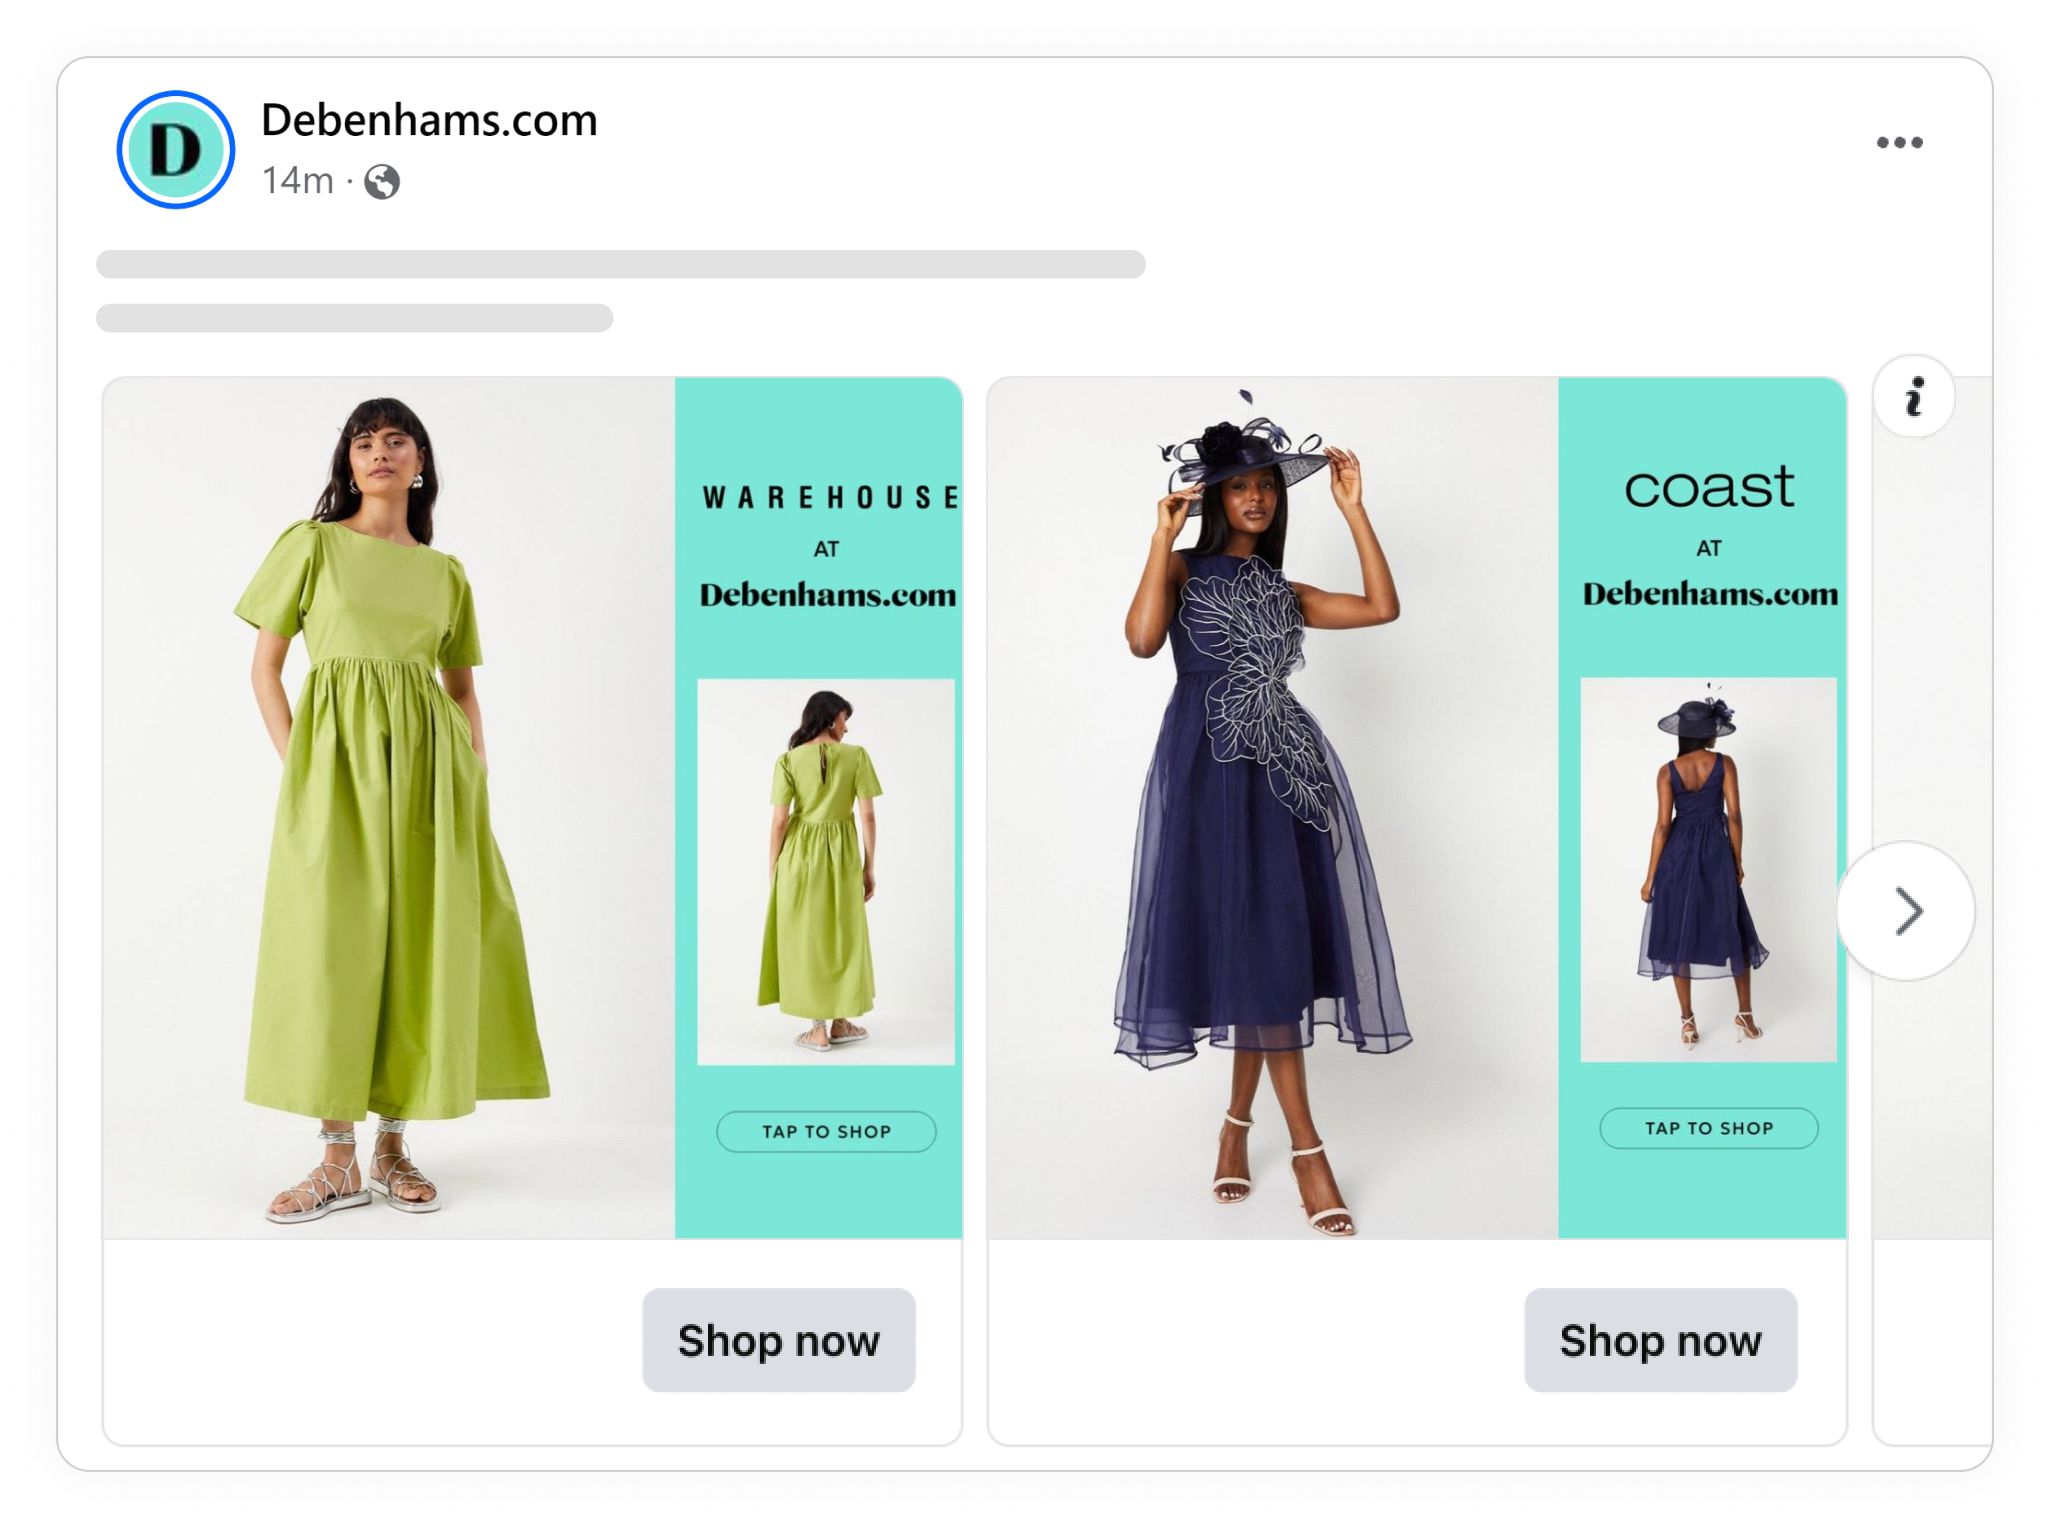
Showing Categories in your Catalog Ads
Here's how showing product categories on average influence Catalog Ads:
Return On Ad Spend
+131%
Cost Per Purchase
-34%
Click Through Rate
+0%
Cost Per Click
-10%
Conversion Rate
+132%
Usage
3%
These numbers show how Catalog Ads showing categories perform on average compared to Catalog Ads not showing categories.
Remember that these are average numbers. For some brands, categories perform better, and for other brands, categories perform worse.
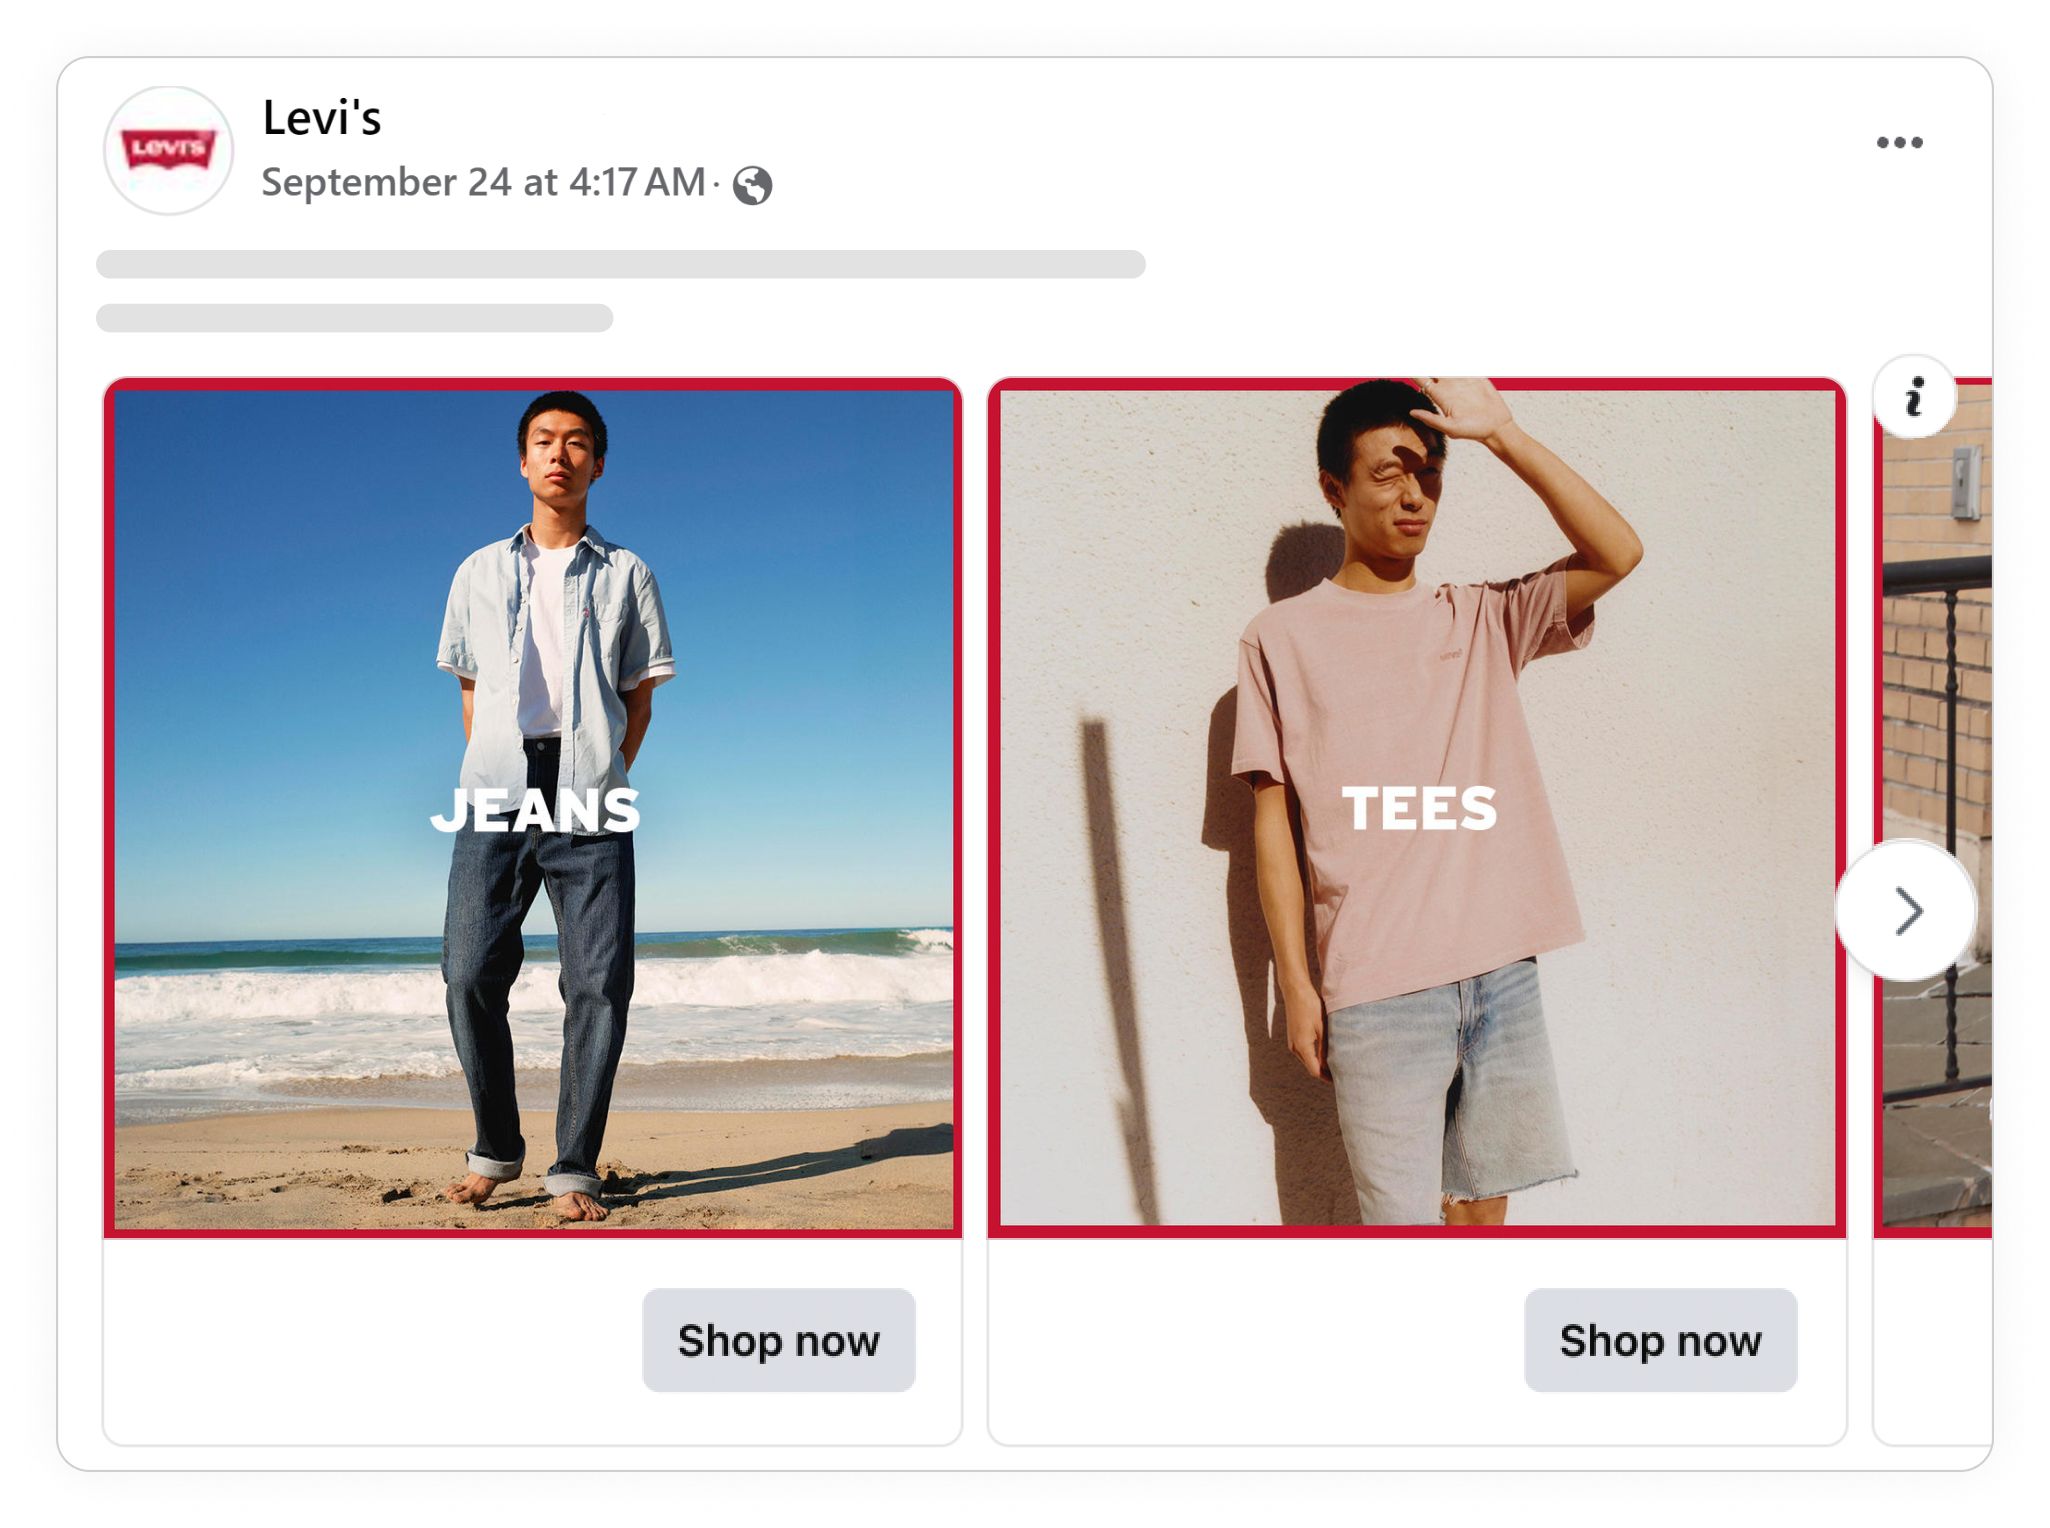
- Very nice use of a catalog ad that puts focus on the category with the text
- Very nice use of beautiful images to show of the product category
- Very nice use of brand color around the edge
Showing Product Descriptions in Catalog Ads
Here's how showing descriptions on average influence Catalog Ads:
Return On Ad Spend
+116%
Cost Per Purchase
-15%
Click Through Rate
+51%
Cost Per Click
-34%
Conversion Rate
-80%
Usage
1%
These numbers show how Catalog Ads showing descriptions perform on average compared to Catalog Ads not showing descriptions.
Remember that these are average numbers. For some brands, descriptions perform better, and for other brands, descriptions perform worse.
- Very nice use of product description to write out the important information
- Very nice use of background image and framing to spice up an otherwise boring product
Bookmark this page by pressing ctrl + D / cmd + D, or by clicking the star icon in your URL bar ⭐️.