
The Christmas eCommerce study: What we can learn from 2.8B impressions

At Christmas, people stop buying the deal. They buy the product, and they buy the shop that sends it.
That is the short version of what 2.8 billion Catalog Ads impressions from December 2025 told us. We looked at 15,000 ads from 1,332 eCommerce shops advertising on Meta with Confect, and compared December with the average month of 2025 (January to October, with Black Month kept out of the comparison).
The long version is below. It covers how big Christmas really is, who gains the most, how the winners set up their account, and which design elements gain or lose when the person looking at your ad is shopping for someone else.
One warning before we start. Black Month and Christmas look alike from the outside: a crowded auction, higher CPMs, more eager shoppers. But the reason to buy is different. In November the shopper hunts for the best price on something they already want. In December the shopper has to pick something for another person and get it right. That one difference explains most of what follows.
Table of contents
- The findings in one place
- Christmas charges everyone more, and pays everyone back
- Who wins Christmas
- How the winners set up their account
- Design: what to put in the ad when the shopper is buying for someone else
- How we group the elements
- Any design element beats none
- Why trust pays when you buy for someone else
- The map: how each element moves from the average month to Christmas
- Social proof starts to pay when the shopper is buying a gift
- The deal matters less
- Four elements gain at Christmas
- Trust matters most for the smallest shops
- Brands and retailers win with different elements
- Shipping info pays in retargeting
- Product Assets work all year, Christmas included
- New products still return 16% more
- The more designs you test, the more you earn
- Your Christmas 2026 playbook
- Christmas Catalog Ads: frequently asked questions
- How we measured this
The findings in one place
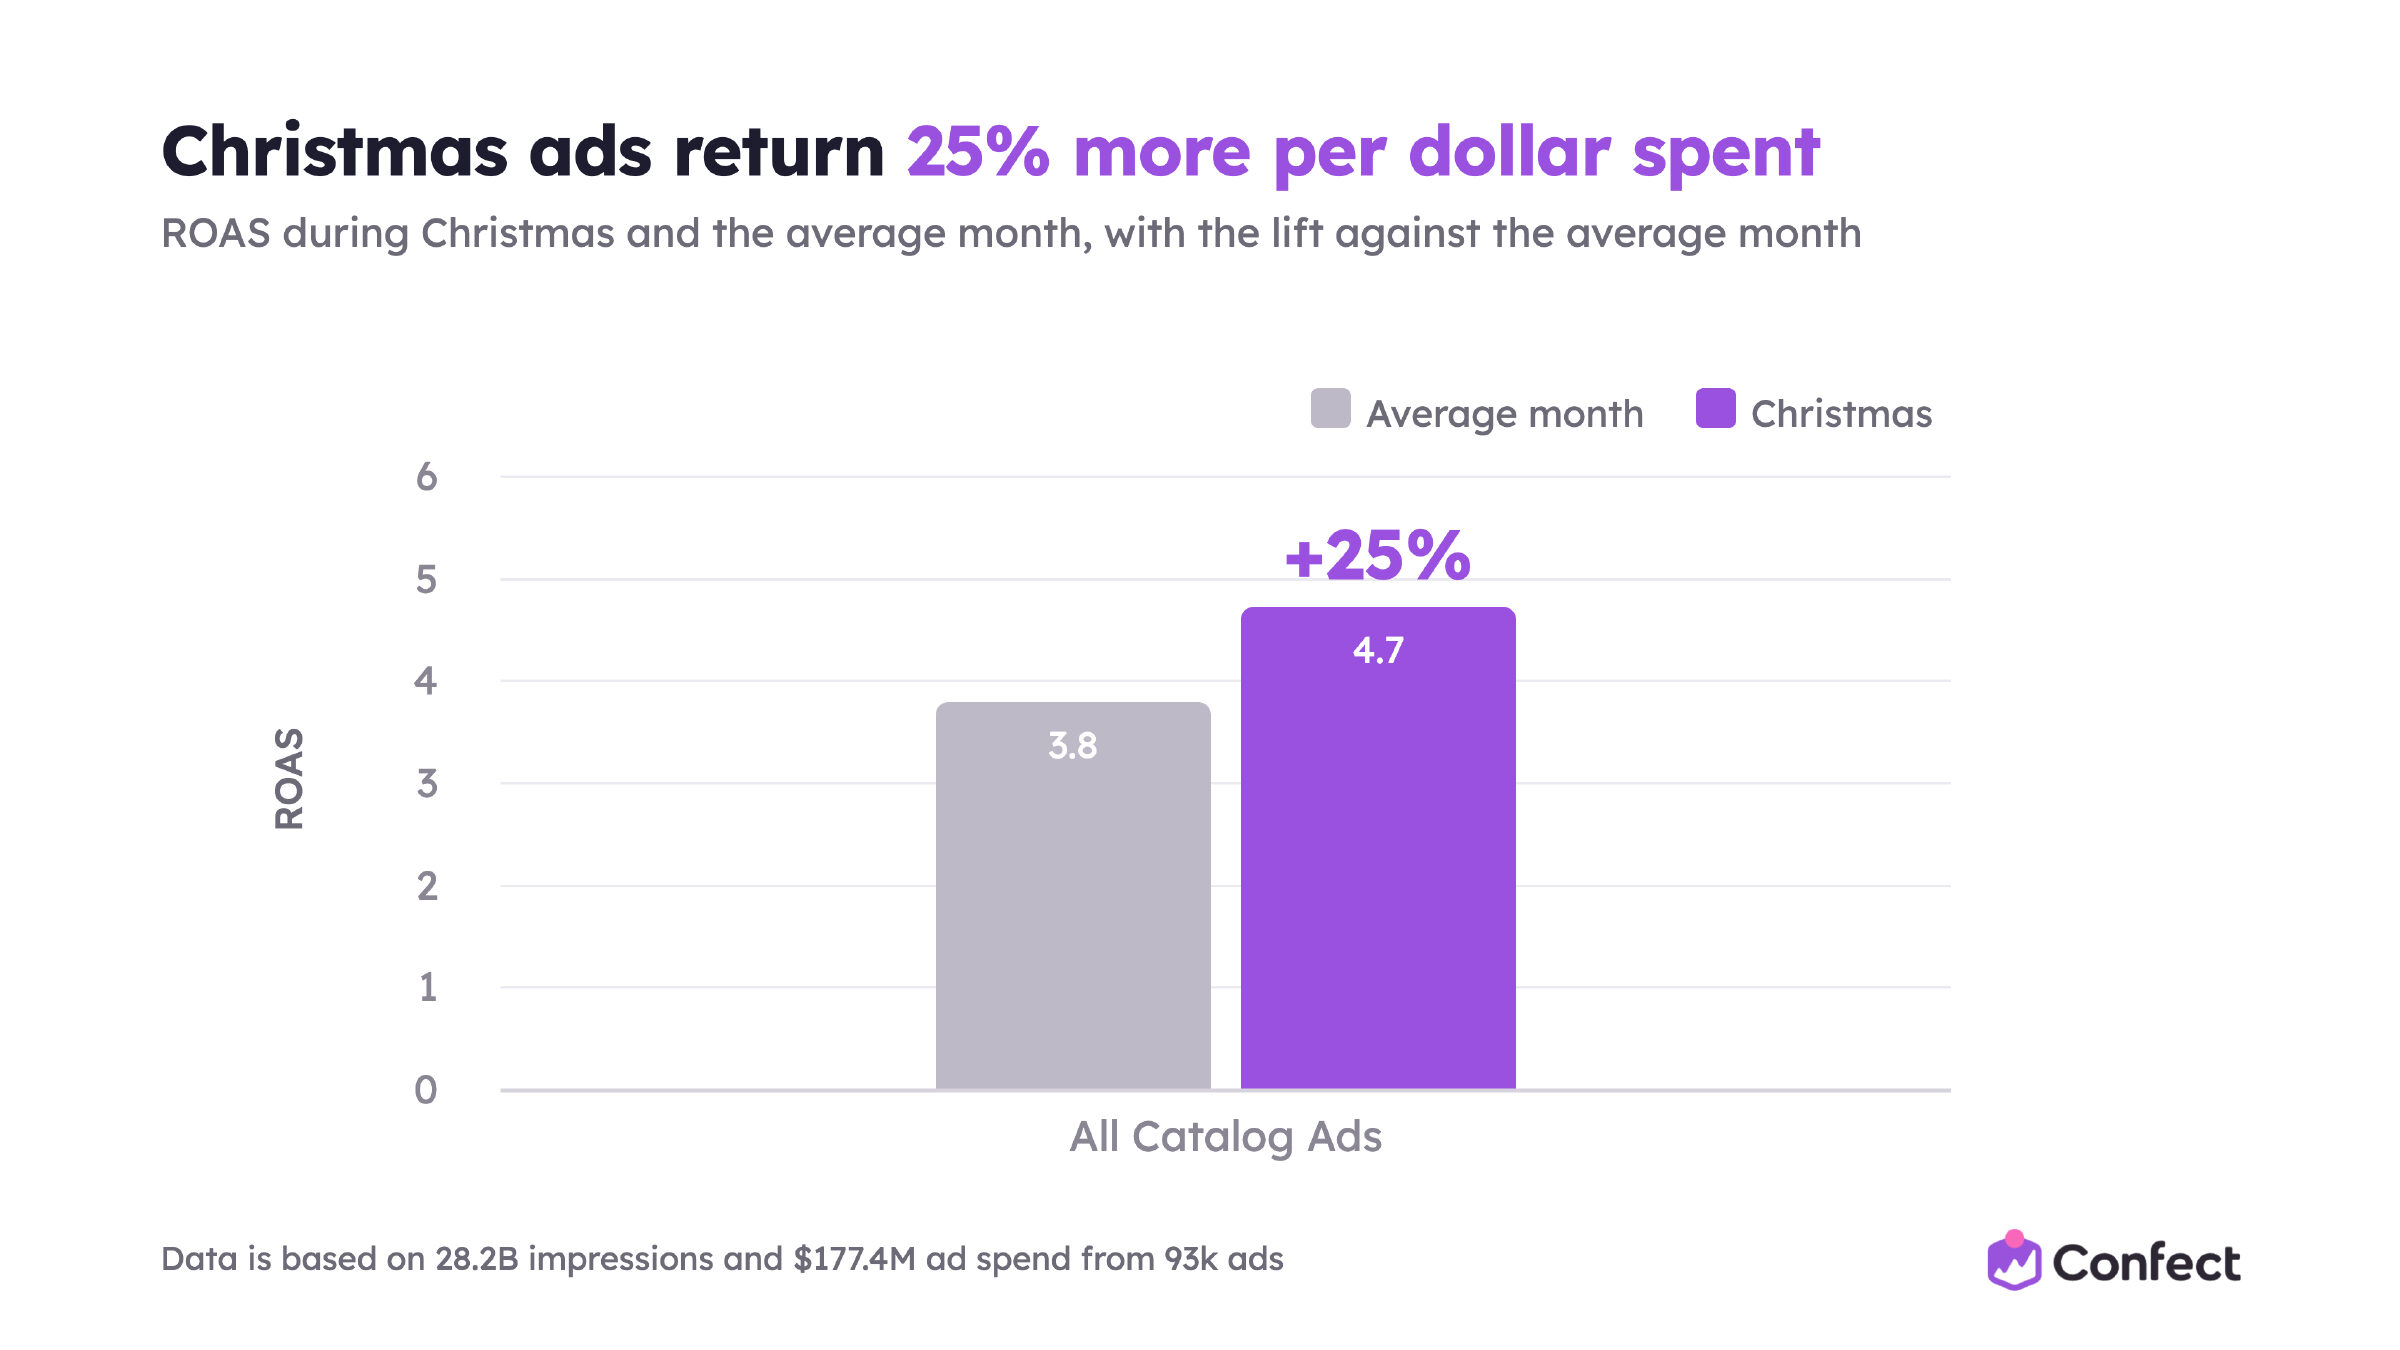
- Christmas pays for itself. CPM rises 21% in December, but shoppers click 15% more, convert 16% more and spend 9% more per order. ROAS ends up 25% higher than in the average month.
- December is the second biggest month of the year. Catalog Ads revenue runs at index 144 against the average month, behind only Black Month at 179.
- Almost every industry gains. Electronics leads with a 50% ROAS lift and a 53% jump in order value. Sports is the exception: more orders, smaller baskets.
- Both shop types win. D2C brands gain 31% and multi-brand retailers 17%, and both run a higher ROAS than in any normal month.
- Gifts sit under $100. Shops with a typical order under $100 gain 31%, the higher buckets 15 to 18%.
- Keep both funnels running. Prospecting and retargeting both return about 25% more at Christmas. Advertisers who also run traffic campaigns get 34% more from their Catalog Ads than the average Christmas advertiser.
- Commit to Catalog Ads. Advertisers with over two thirds of their Meta spend on Catalog Ads return 11% more than the typical Christmas ad. Under a third, and they return less.
- Trust beats the deal. Discount elements lose more than half their edge in December. Social proof goes from -6% to +18%, calls to action from +4% to +29%, voucher codes from +27% to +40%.
- Trust matters most for the smallest shops. Ads with trust elements return 36% more for small advertisers at Christmas, 16% for mid-sized and 7% for big ones.
- Product Assets hold all year. Ads with Product Assets return 29% more at Christmas and 31% more in the average month. It is the most robust design finding in the study.
- Test many designs. Ads with six designs in the variant return 45% more than the typical Christmas ad. Ads with none return 12% less.
Christmas charges everyone more, and pays everyone back
The first thing you notice in December is the price. CPM rises 21% against the average month. More advertisers want the same people, so the auction gets expensive.
The second thing you notice is that nobody seems to mind. Shoppers click 15% more, convert 16% more and spend 9% more per order. Put those together and the typical Catalog Ad returns 25% more per dollar in December than in a normal month. Cost per purchase actually falls, by about 6%, because the gains in clicks and conversion outweigh the dearer impressions.
So the first rule of Christmas is the simplest: do not cut your budget because CPM goes up. The people you are paying more to reach are worth more.
How big December really is
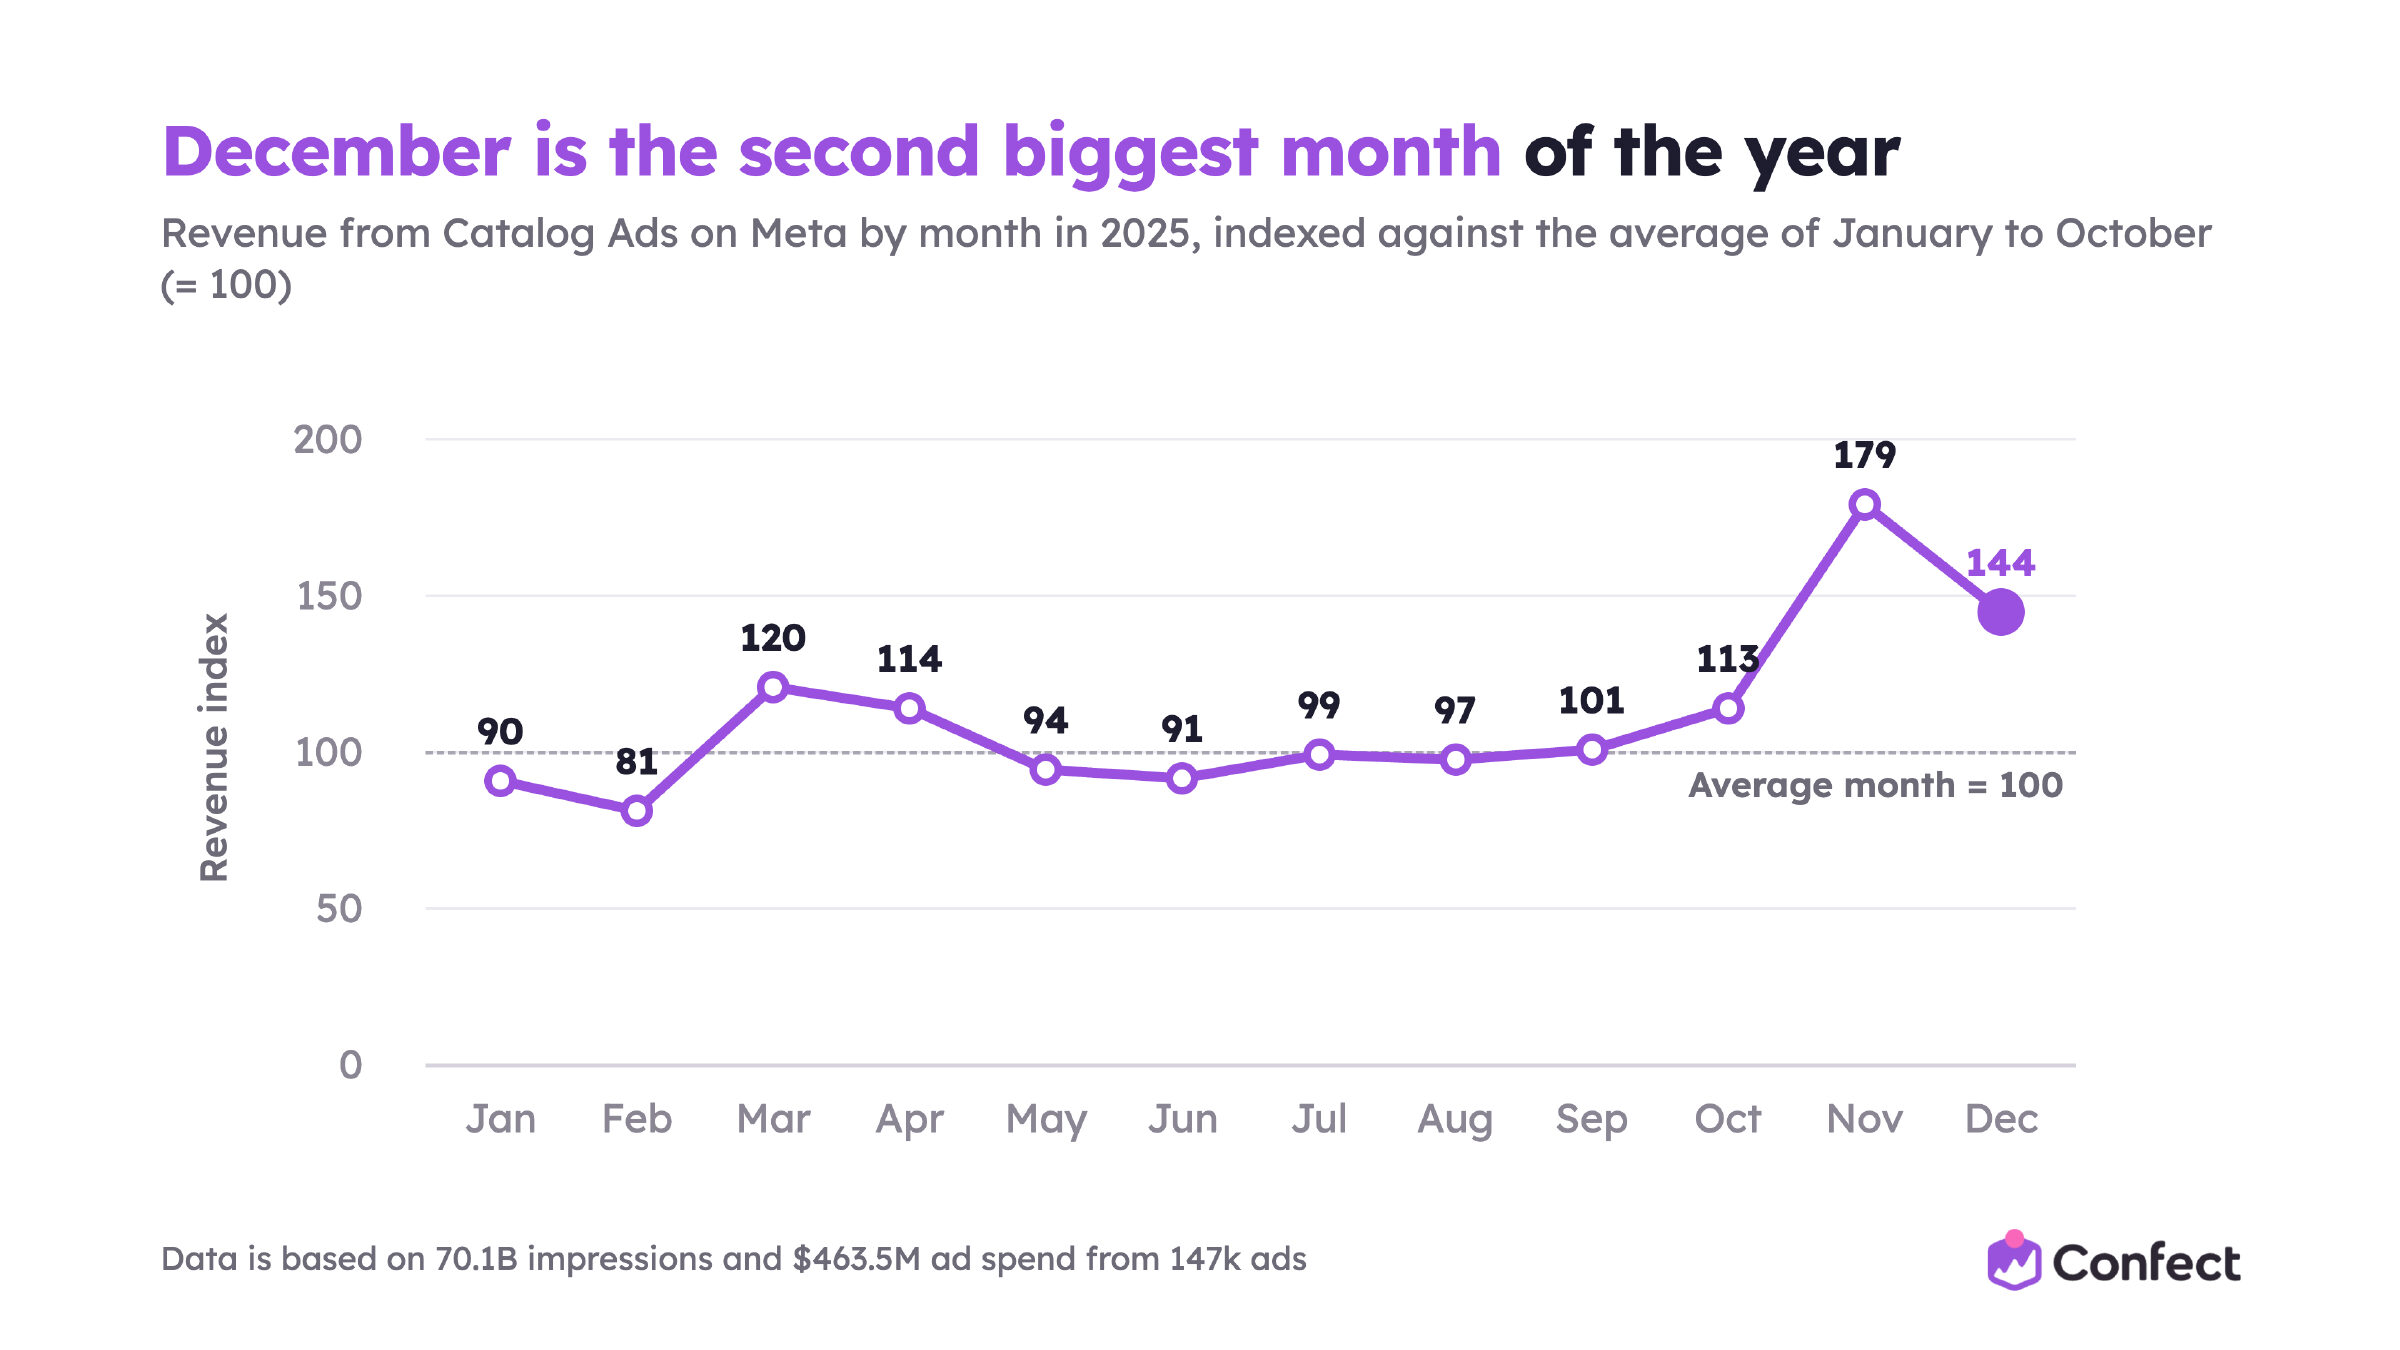
December is the second biggest month of the year for Catalog Ads revenue, at index 144 against the average month. Only Black Month is bigger, at 179.
And part of that November peak is Christmas too. Plenty of people buy their gifts in the Black Friday sales, so the collective November and December season is bigger than either month looks on its own.
Look at where the line starts climbing. October already runs at 113, before most Christmas ads go live. Then 179 in November and 144 in December. The quietest month of the year, February, sits at 81.
Put differently, a good December is worth close to two Februaries. That is why the Christmas design deserves the same attention as the Black Friday one, not the leftovers from it.
Three forces make Christmas different
It is tempting to treat Christmas as Black Month with snow. It is not. Three things change at once.
More money in the auction. CPM is up 21%. Every shop with something giftable is bidding, and many of them have saved budget for exactly this month.
Shoppers in buying mode. Conversion rate is up 16% and click-through rate up 15%. People are not browsing. They have a list, a deadline and a budget, and they are looking for things that fit.
Buying for someone else. This is the one that matters for your creative. A gift is a riskier purchase than something you buy for yourself.

Marketing theory calls it perceived risk: there is performance risk (will it work, will it fit) and social risk (what will they think of me if it is wrong). When risk goes up, shoppers lean on what they can trust: a product they recognise, a brand they know, a shop that other people have bought from.
Keep that third force in mind. The rest of the study is largely a list of its consequences.
Who wins Christmas
Almost everyone, as it turns out. But not equally.
By industry: electronics leads, sports sells more but smaller
Electronics gains 50% in ROAS at Christmas, food and drinks 33%, fashion 27%, home 26%, beauty and health 11%. Sports is flat at 1%, which within our rules counts as no difference.
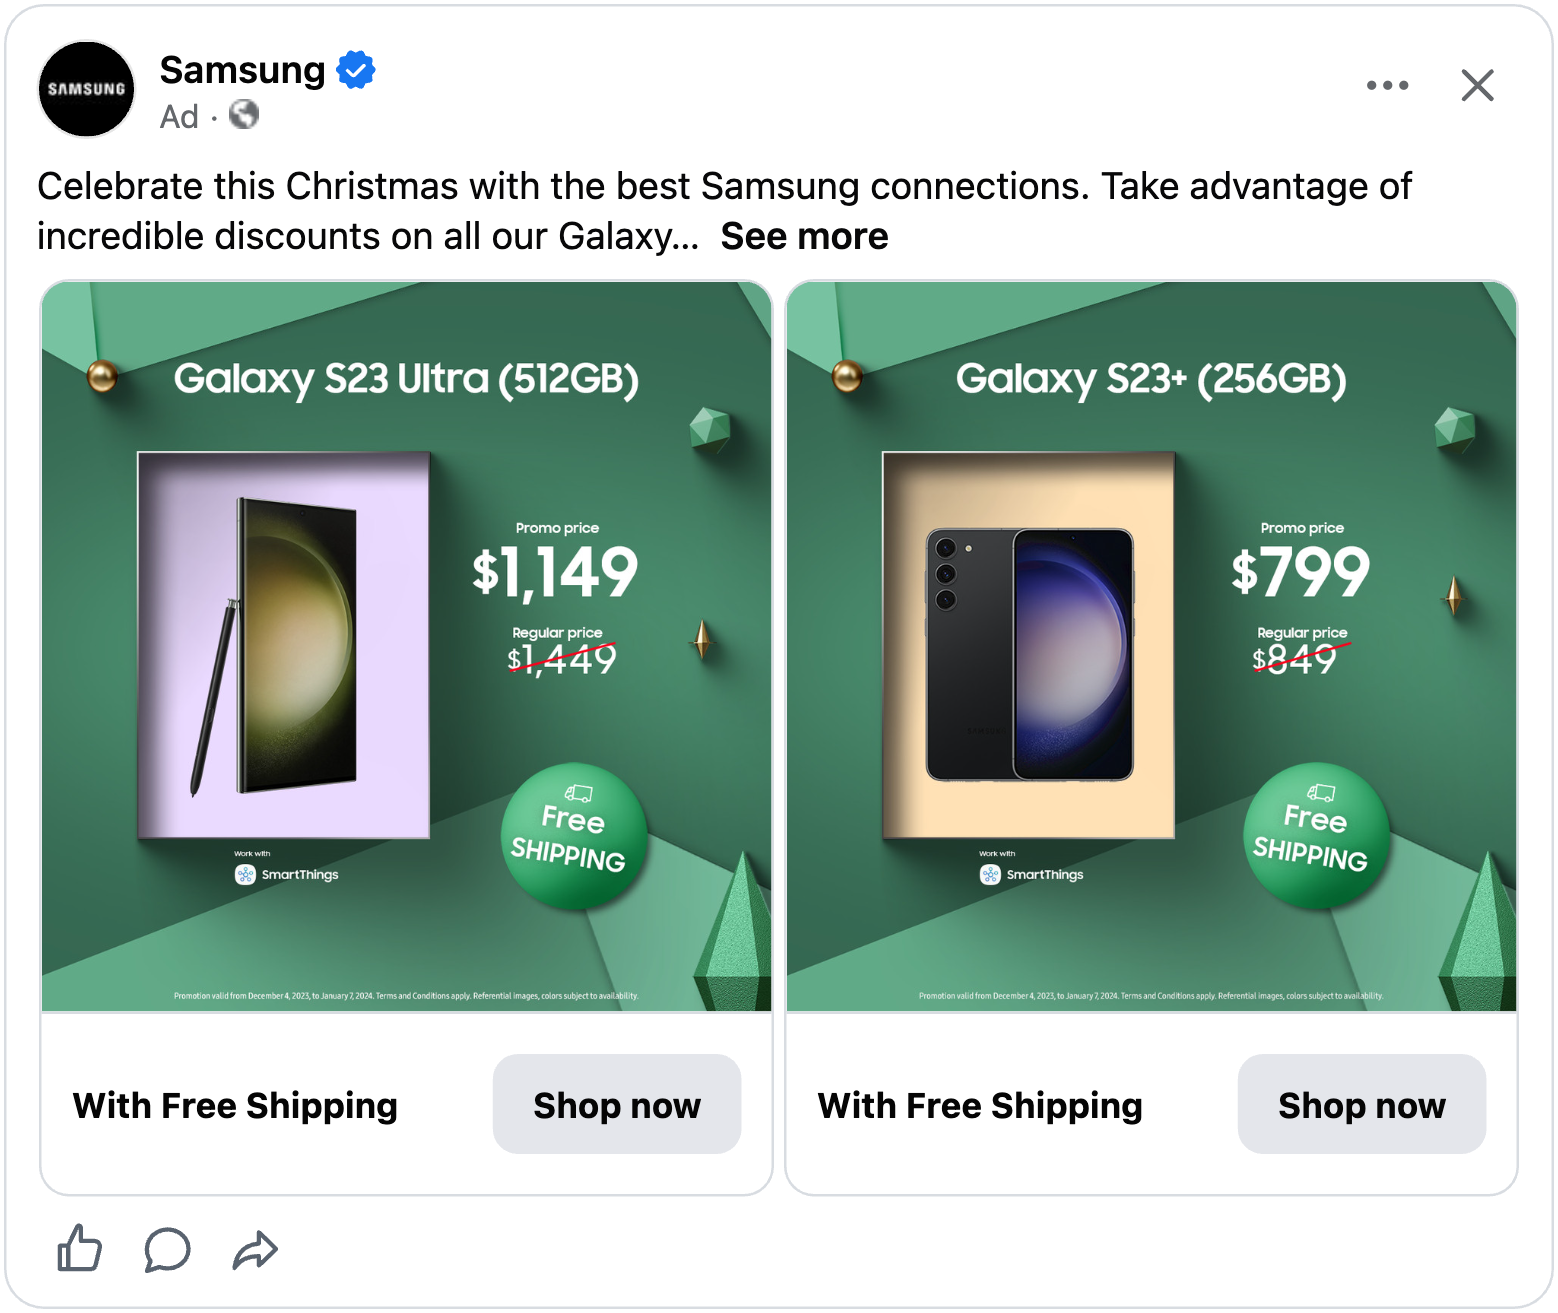
Samsung shows the gift-sized end of electronics. A Galaxy S23 Ultra at a $1,149 promo price over the regular $1,449, a free shipping badge on every card, and green and gold framing that makes a phone look like a present rather than a spec sheet.
The electronics number comes with a puzzle. Click-through rate, conversion rate and CPM move about as much as they do for everyone else, but the average order jumps 53%. Either people are gifting big-ticket electronics, or electronics shops sell cables and accessories most of the year and headphones and consoles in December. We cannot tell from the data yet, and we are not going to guess. Both readings point the same way for an electronics shop, though: December is the month to push the gift-sized products, not the stocking fillers.
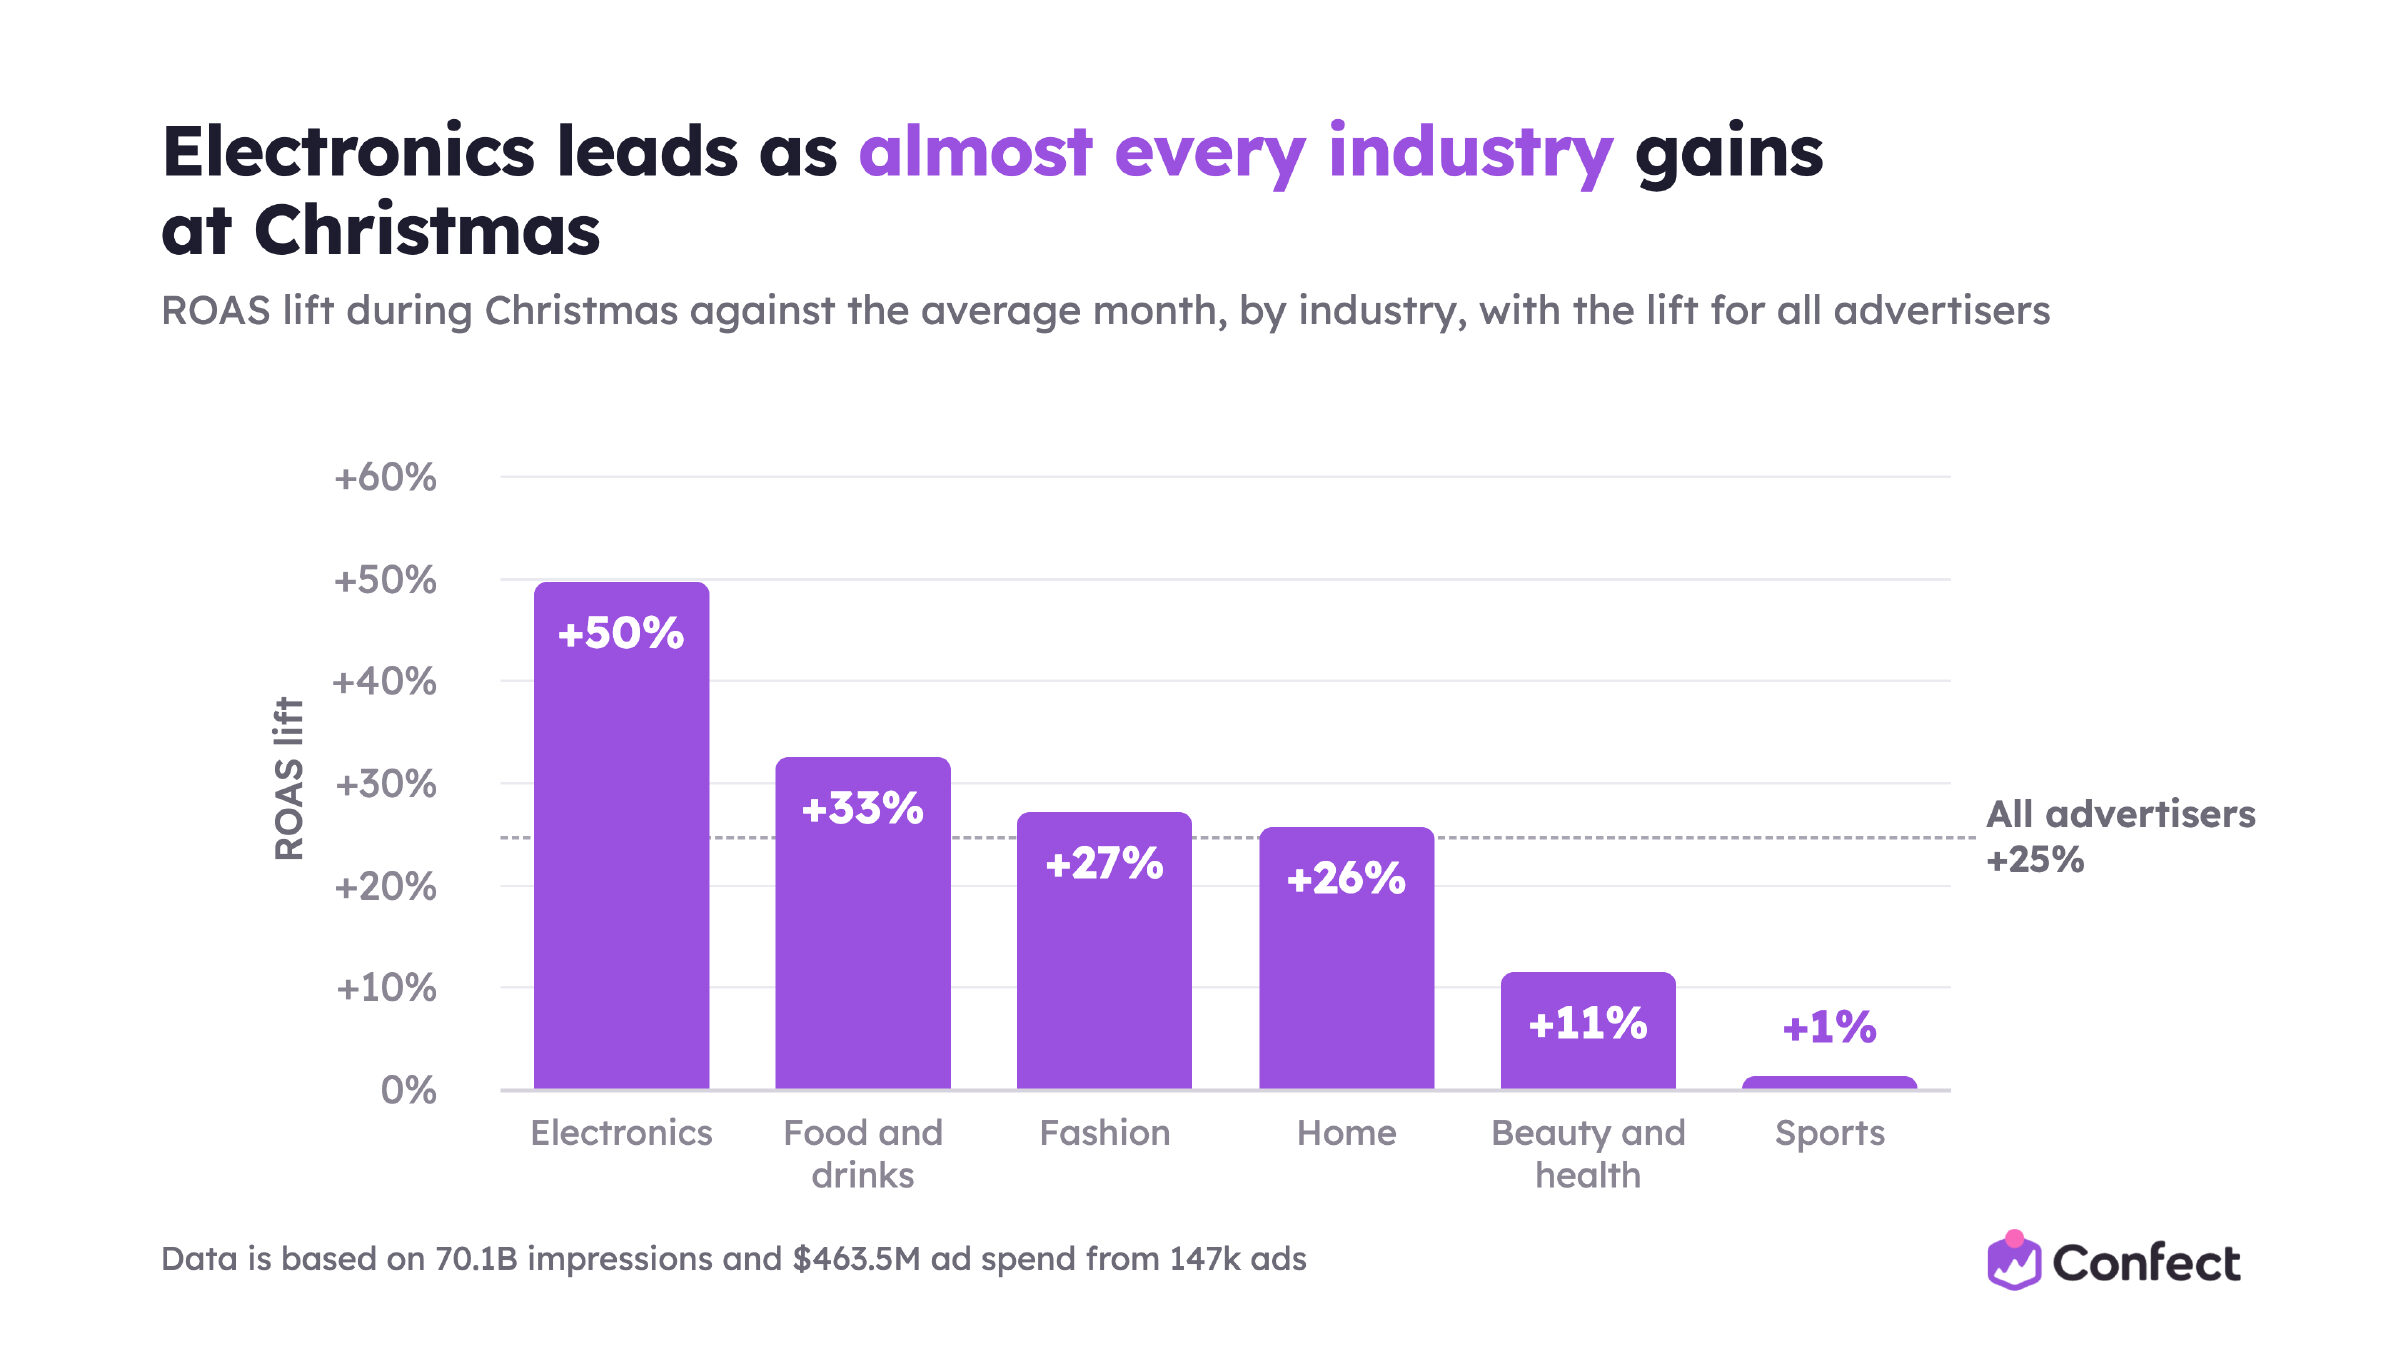
Sports is the mirror image, and the story is more fun. The rest of the year, the sports basket is your own gear, and you know your size. In December you are buying for your brother-in-law, and you do not. So you pick the safe, size-free, cheaper things: socks, gloves, a bottle, a cap. They are easy to say yes to, which is why conversion rate jumps 37%, but they are small, which is why the average order falls 8%. Christmas gives sports shops more orders and more new customers, not bigger orders. If you sell sports gear, that tells you what to put in front of people in December: size-free items at gift prices, not the expensive kit.
By shop type: brands and retailers both gain
D2C brands gain 31% at Christmas, multi-brand retailers 17%. Both are a lot.
Two things are worth remembering before you compare them. First, the absolute level: multi-brand retailers already run a higher ROAS (about 6.0 at Christmas against 4.1 for brands). Second, they need it. A retailer's margin is thinner, so a retailer might need a ROAS of 10 to make money where a brand can profit at 2 or 3. A smaller lift on a bigger number is still a good Christmas.
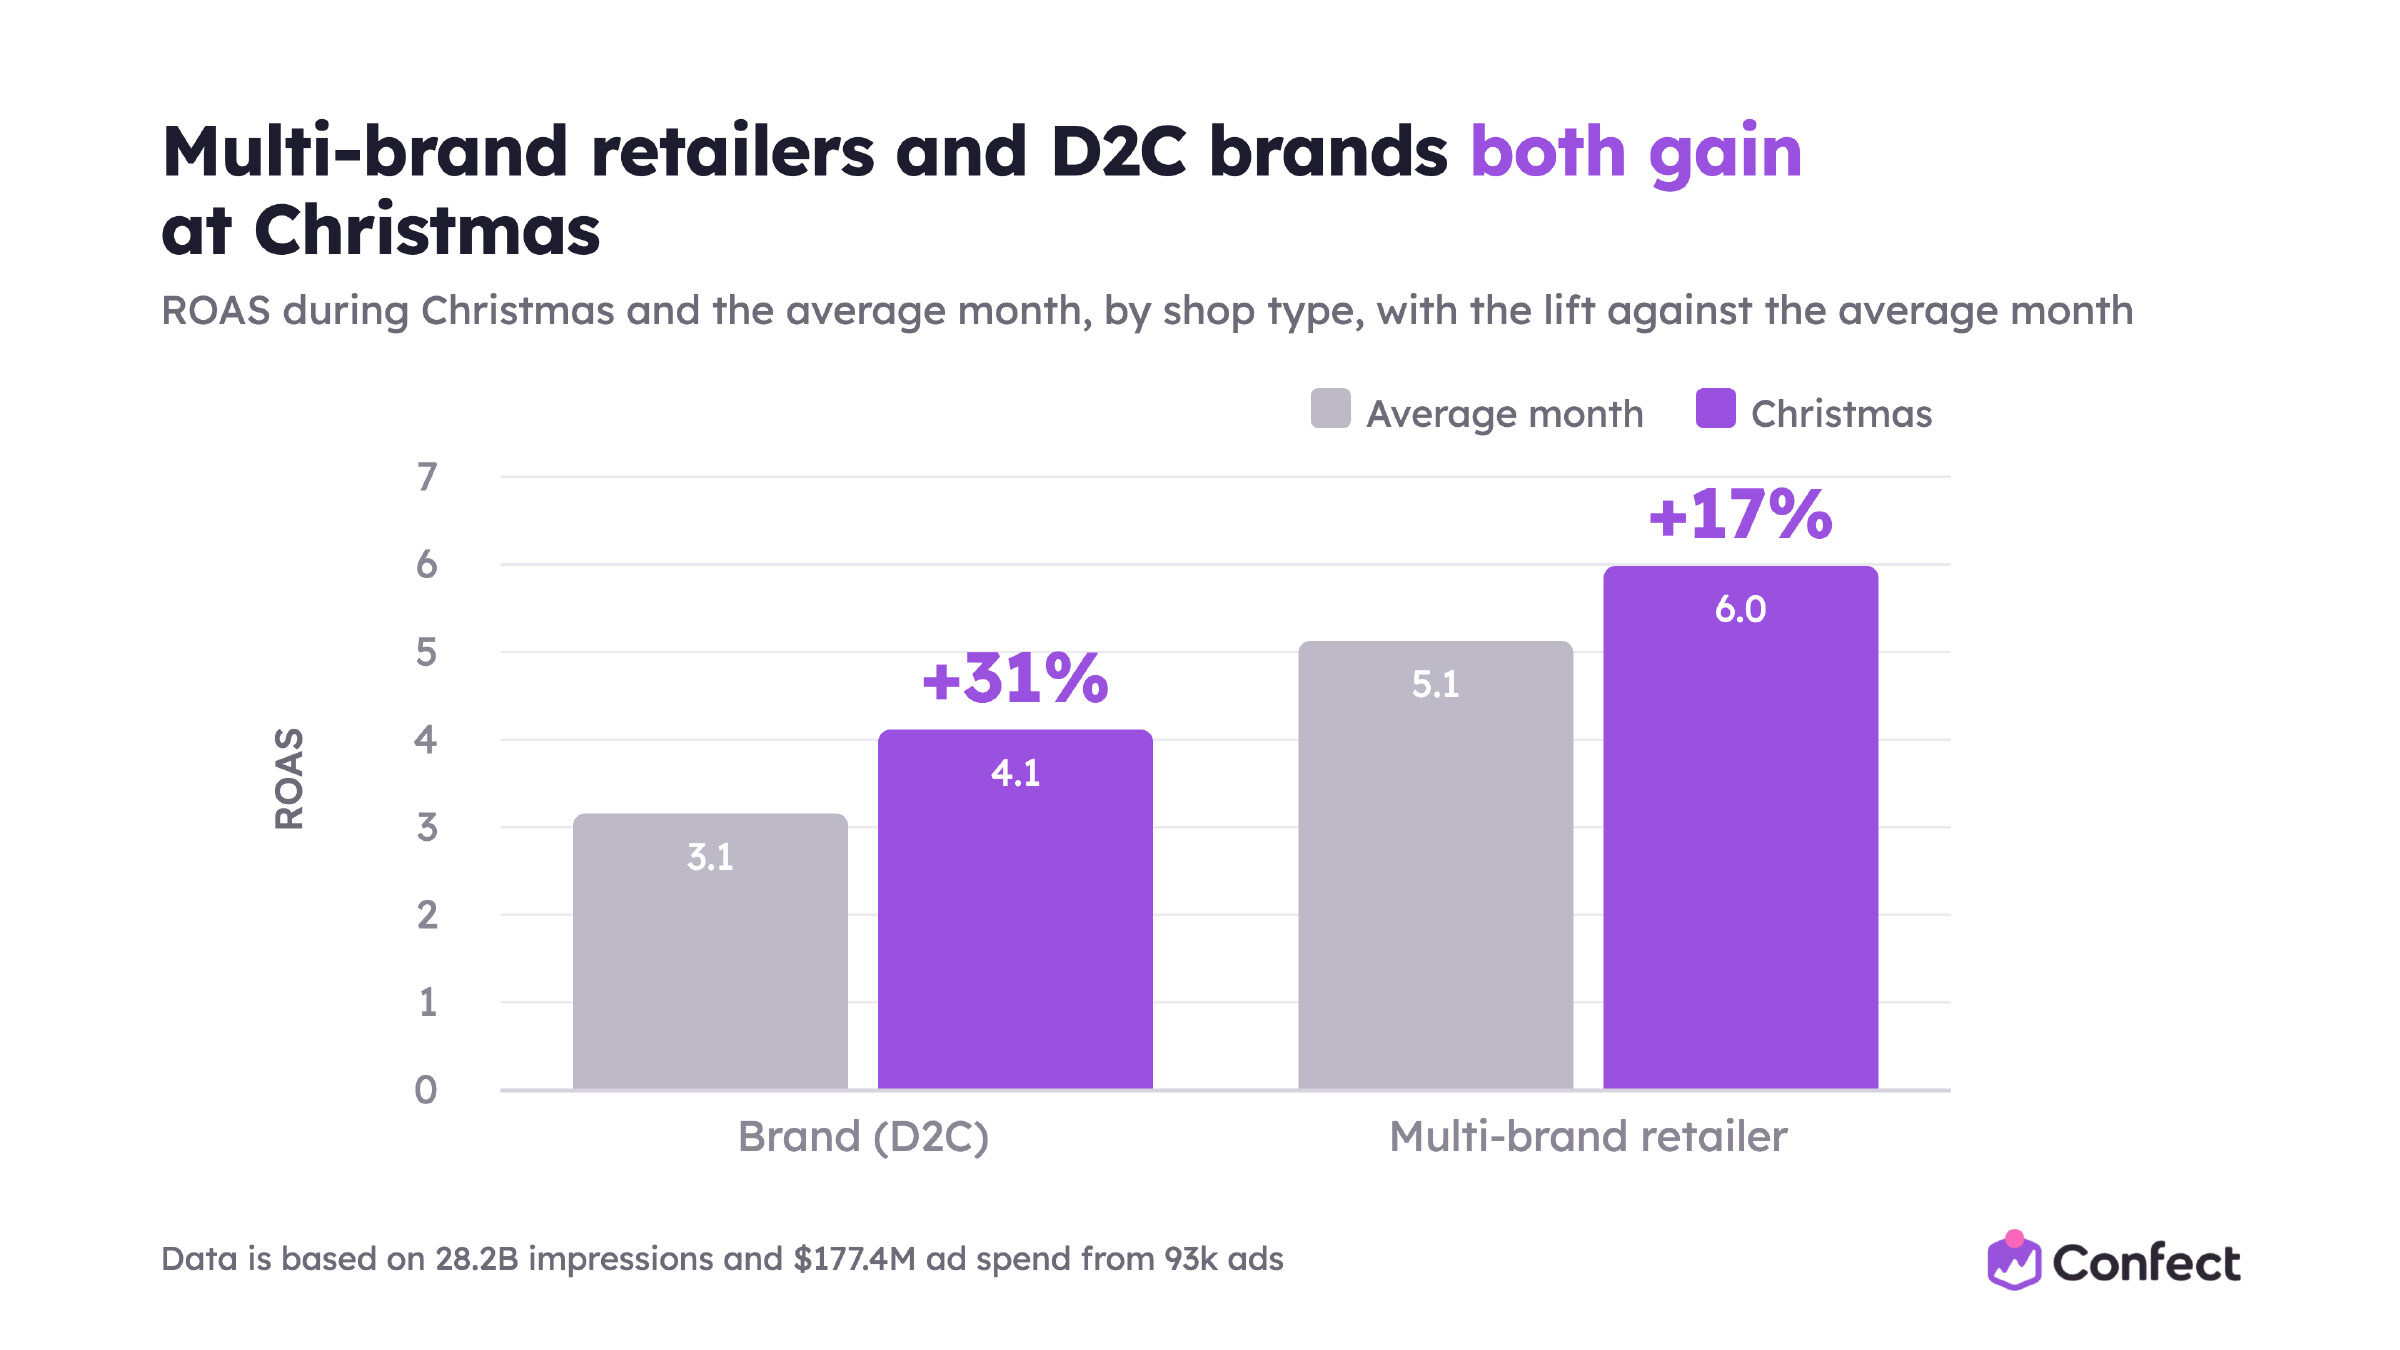
Why do brands gain a little more? Think about the gift buyer again. If you already know which product you want for someone, the safest place to buy it is from the people who make it. That is trust transfer: the trust you have in the brand moves to the shop. A retailer selling the same product has to earn that trust another way, and we will come back to how in the design section.
By order value: gifts sit under $100
Shops with a typical order under $100 gain 31% at Christmas. Shops between $100 and $200 gain 18%, and shops above $200 gain 15%.
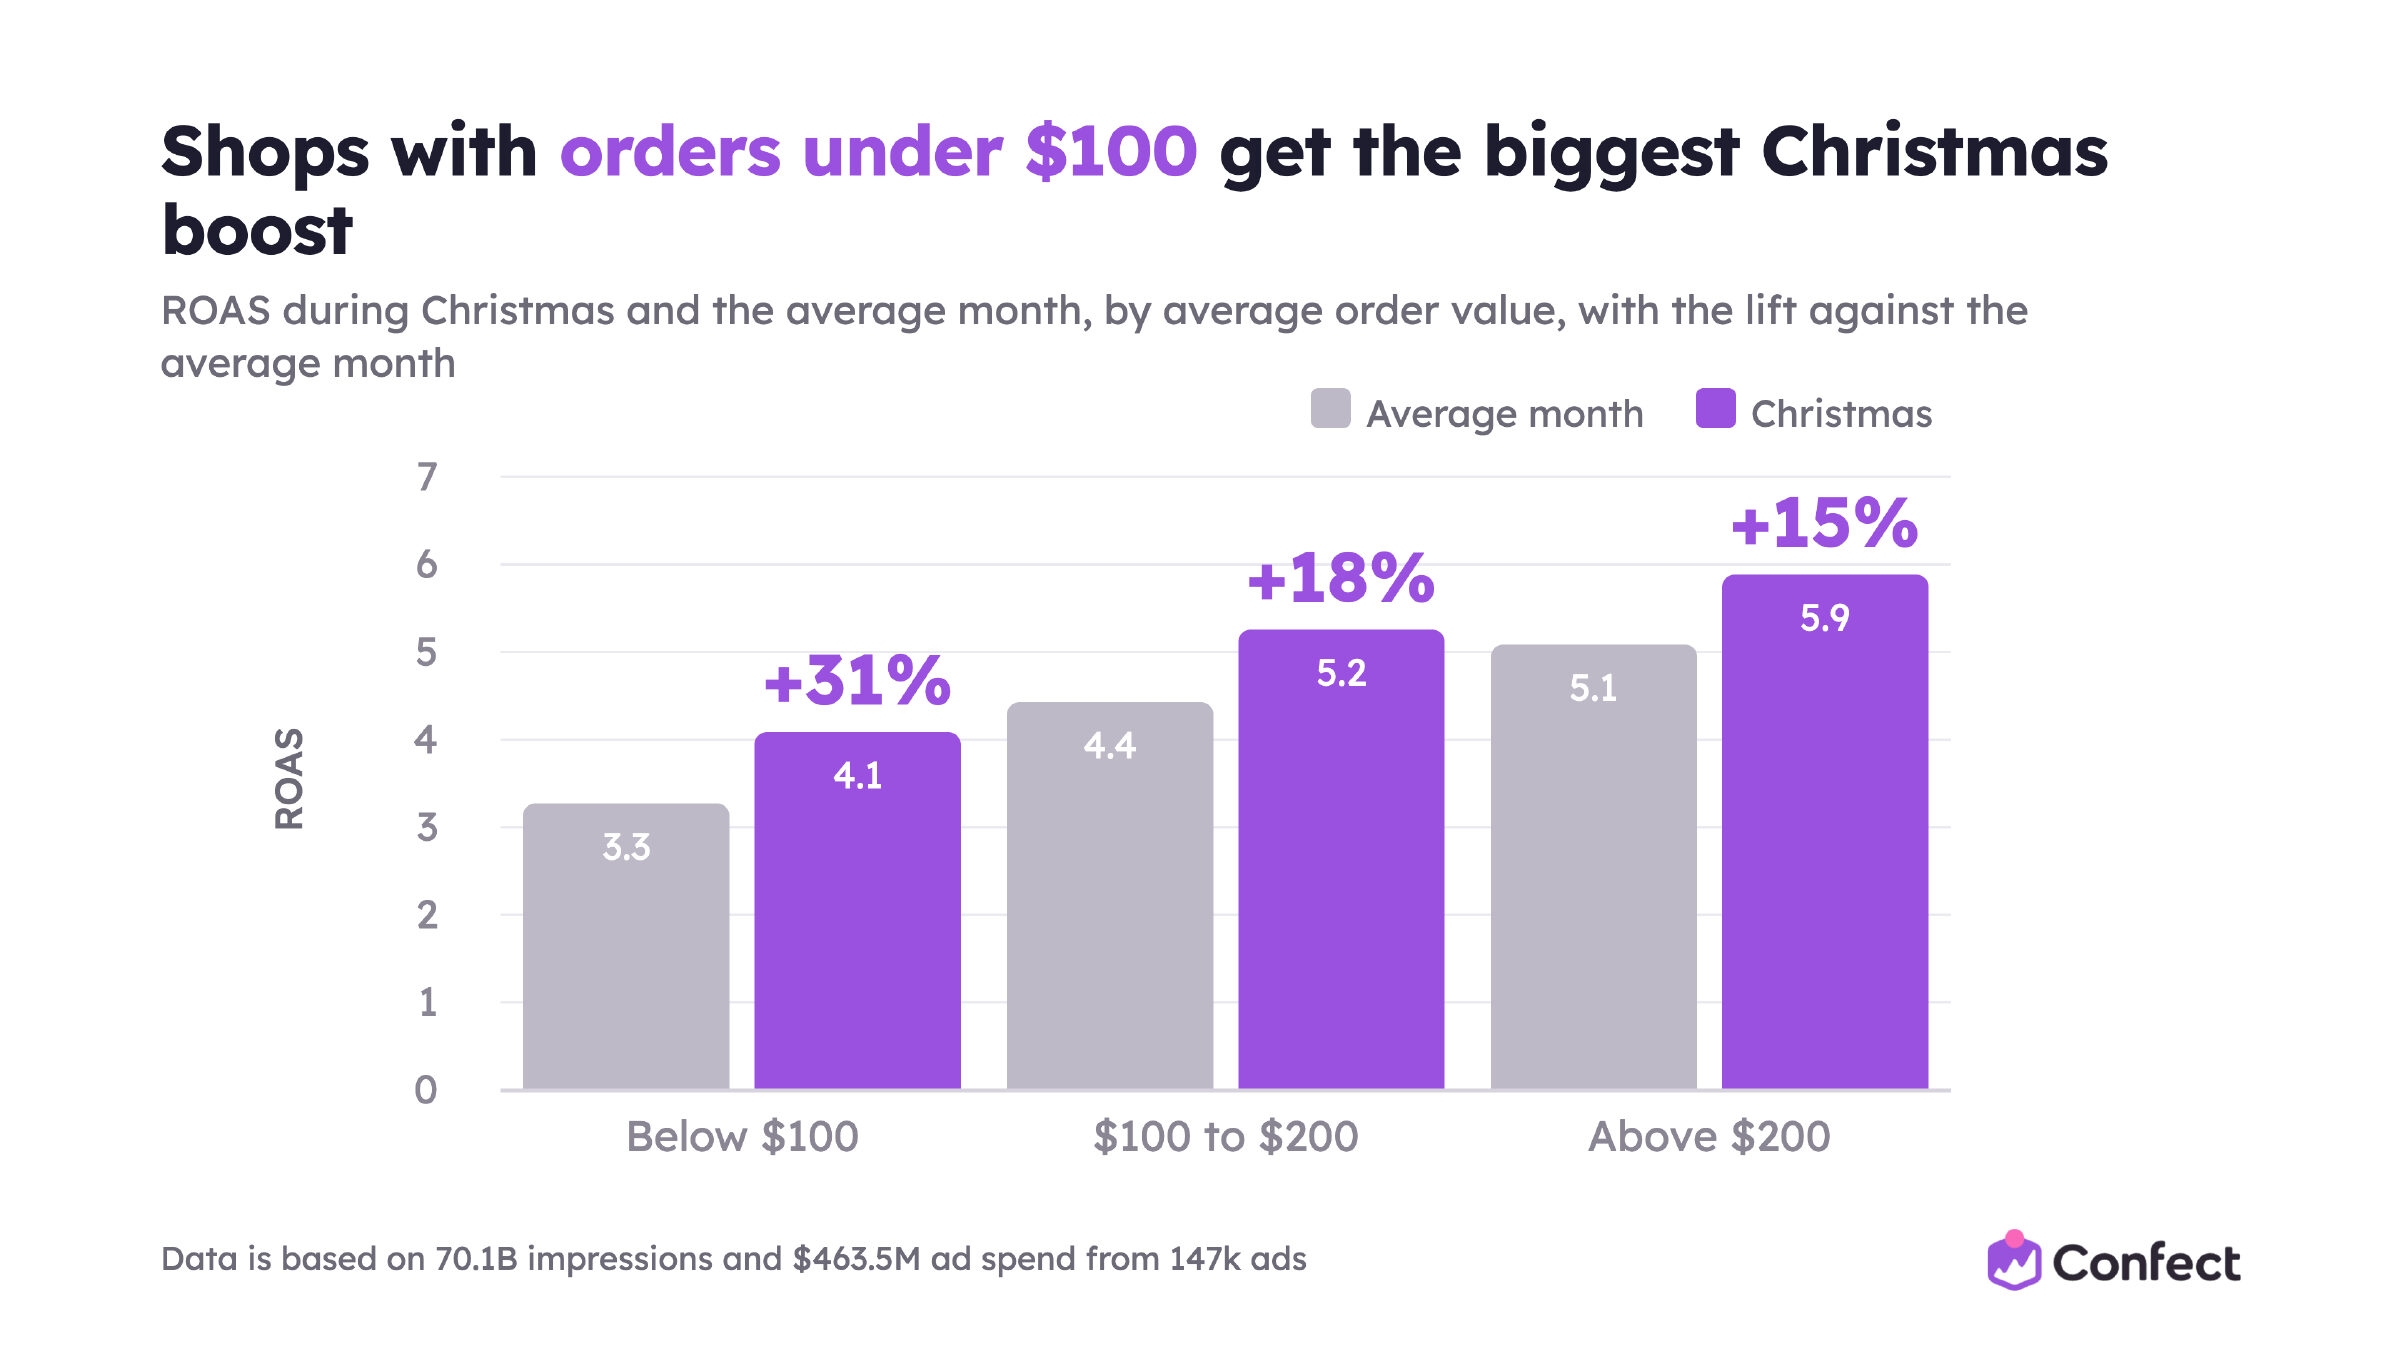
That is probably just where most gifts fall. The average Christmas gift is likely under $100, so shops that sell at that price point are selling exactly what the shopper came for.
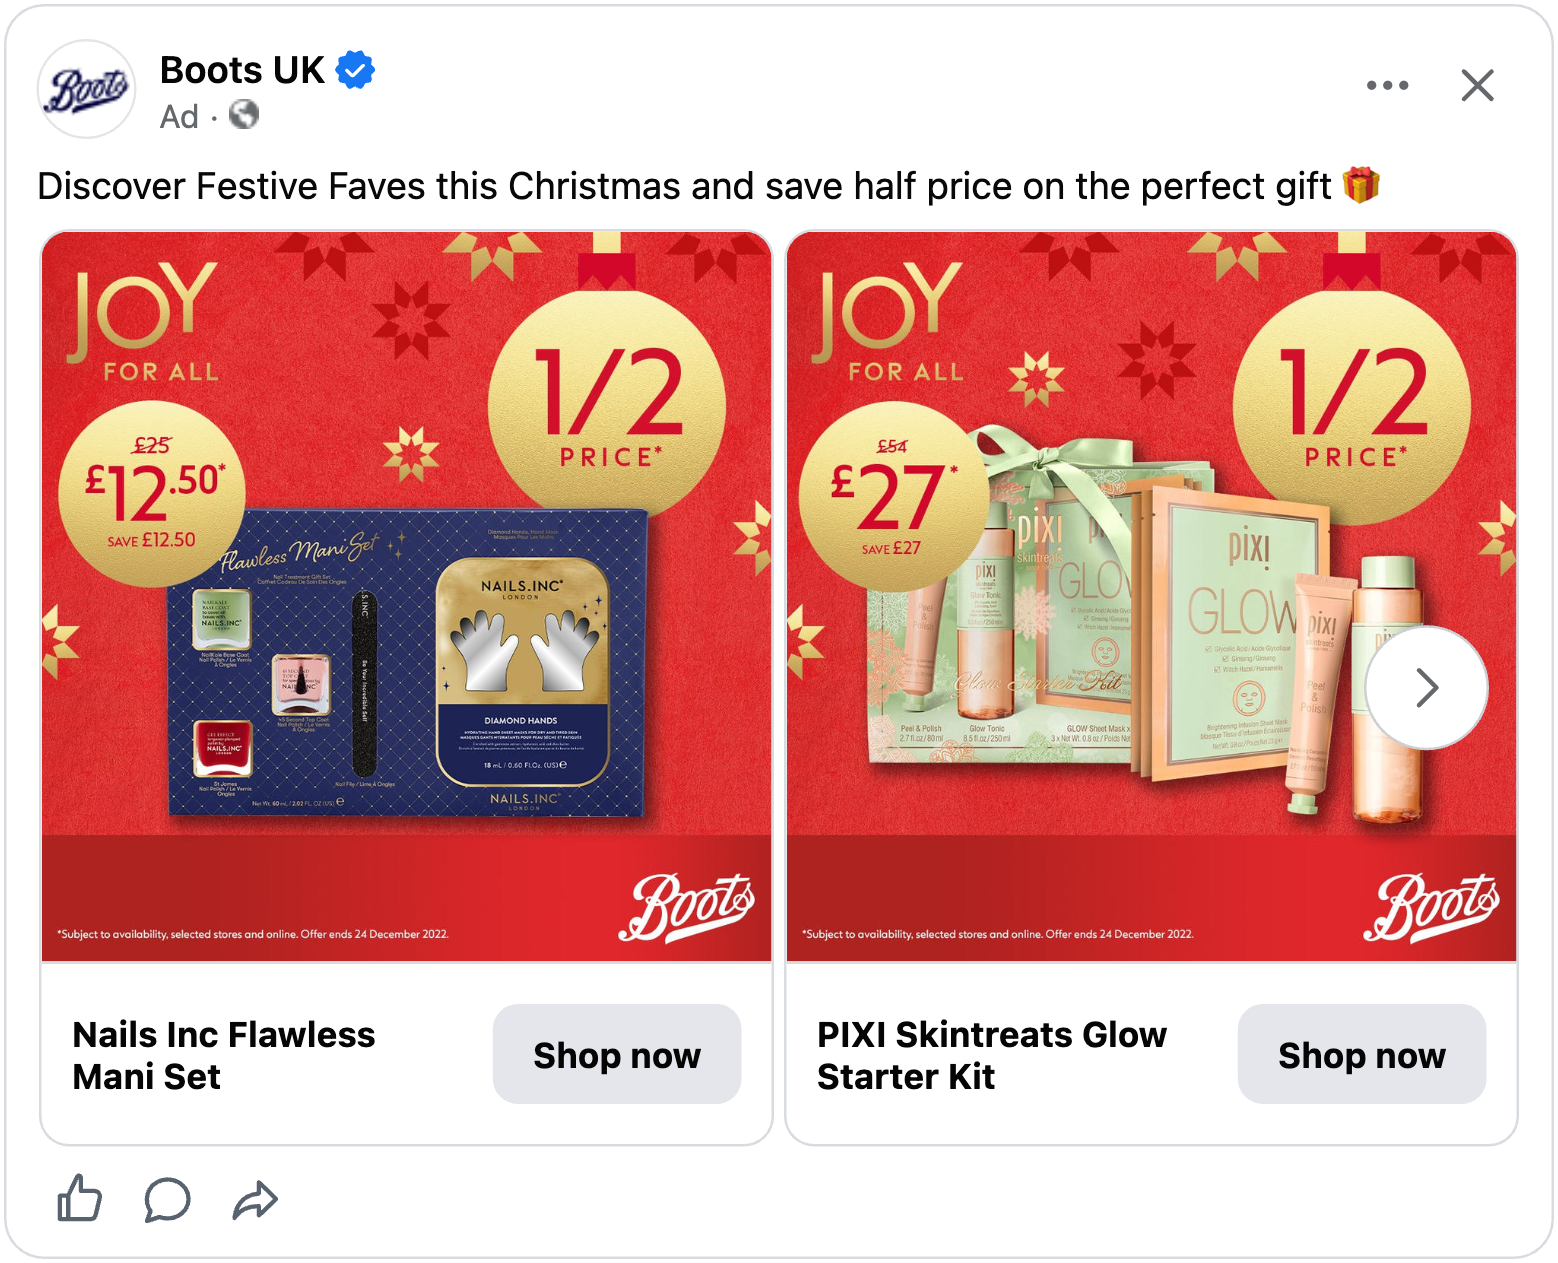
Boots shows what gift-priced looks like. The products are ready-made gift sets, a manicure set at £12.50 and a skincare kit at £27, and every card reads like a Christmas card: red, gold baubles and “Joy for all” across the top.
A gift set also solves the sports problem from earlier. No size, no guesswork, nothing for the recipient to exchange. The ad has already decided it is a gift, so the shopper does not have to.
Higher-value shops still run the higher ROAS in absolute terms, so this is not an argument for cutting prices. It is an argument for making sure your gift-priced products are also in the ad.
By price level: it makes little difference
Affordable, mid-range and high-end shops all gain between 21% and 27%, within a few points of the overall 25%. Whether you are cheap or expensive for your industry does not decide your Christmas.
If that sounds like it contradicts the order value finding, it does not. Price level and basket size are different things.
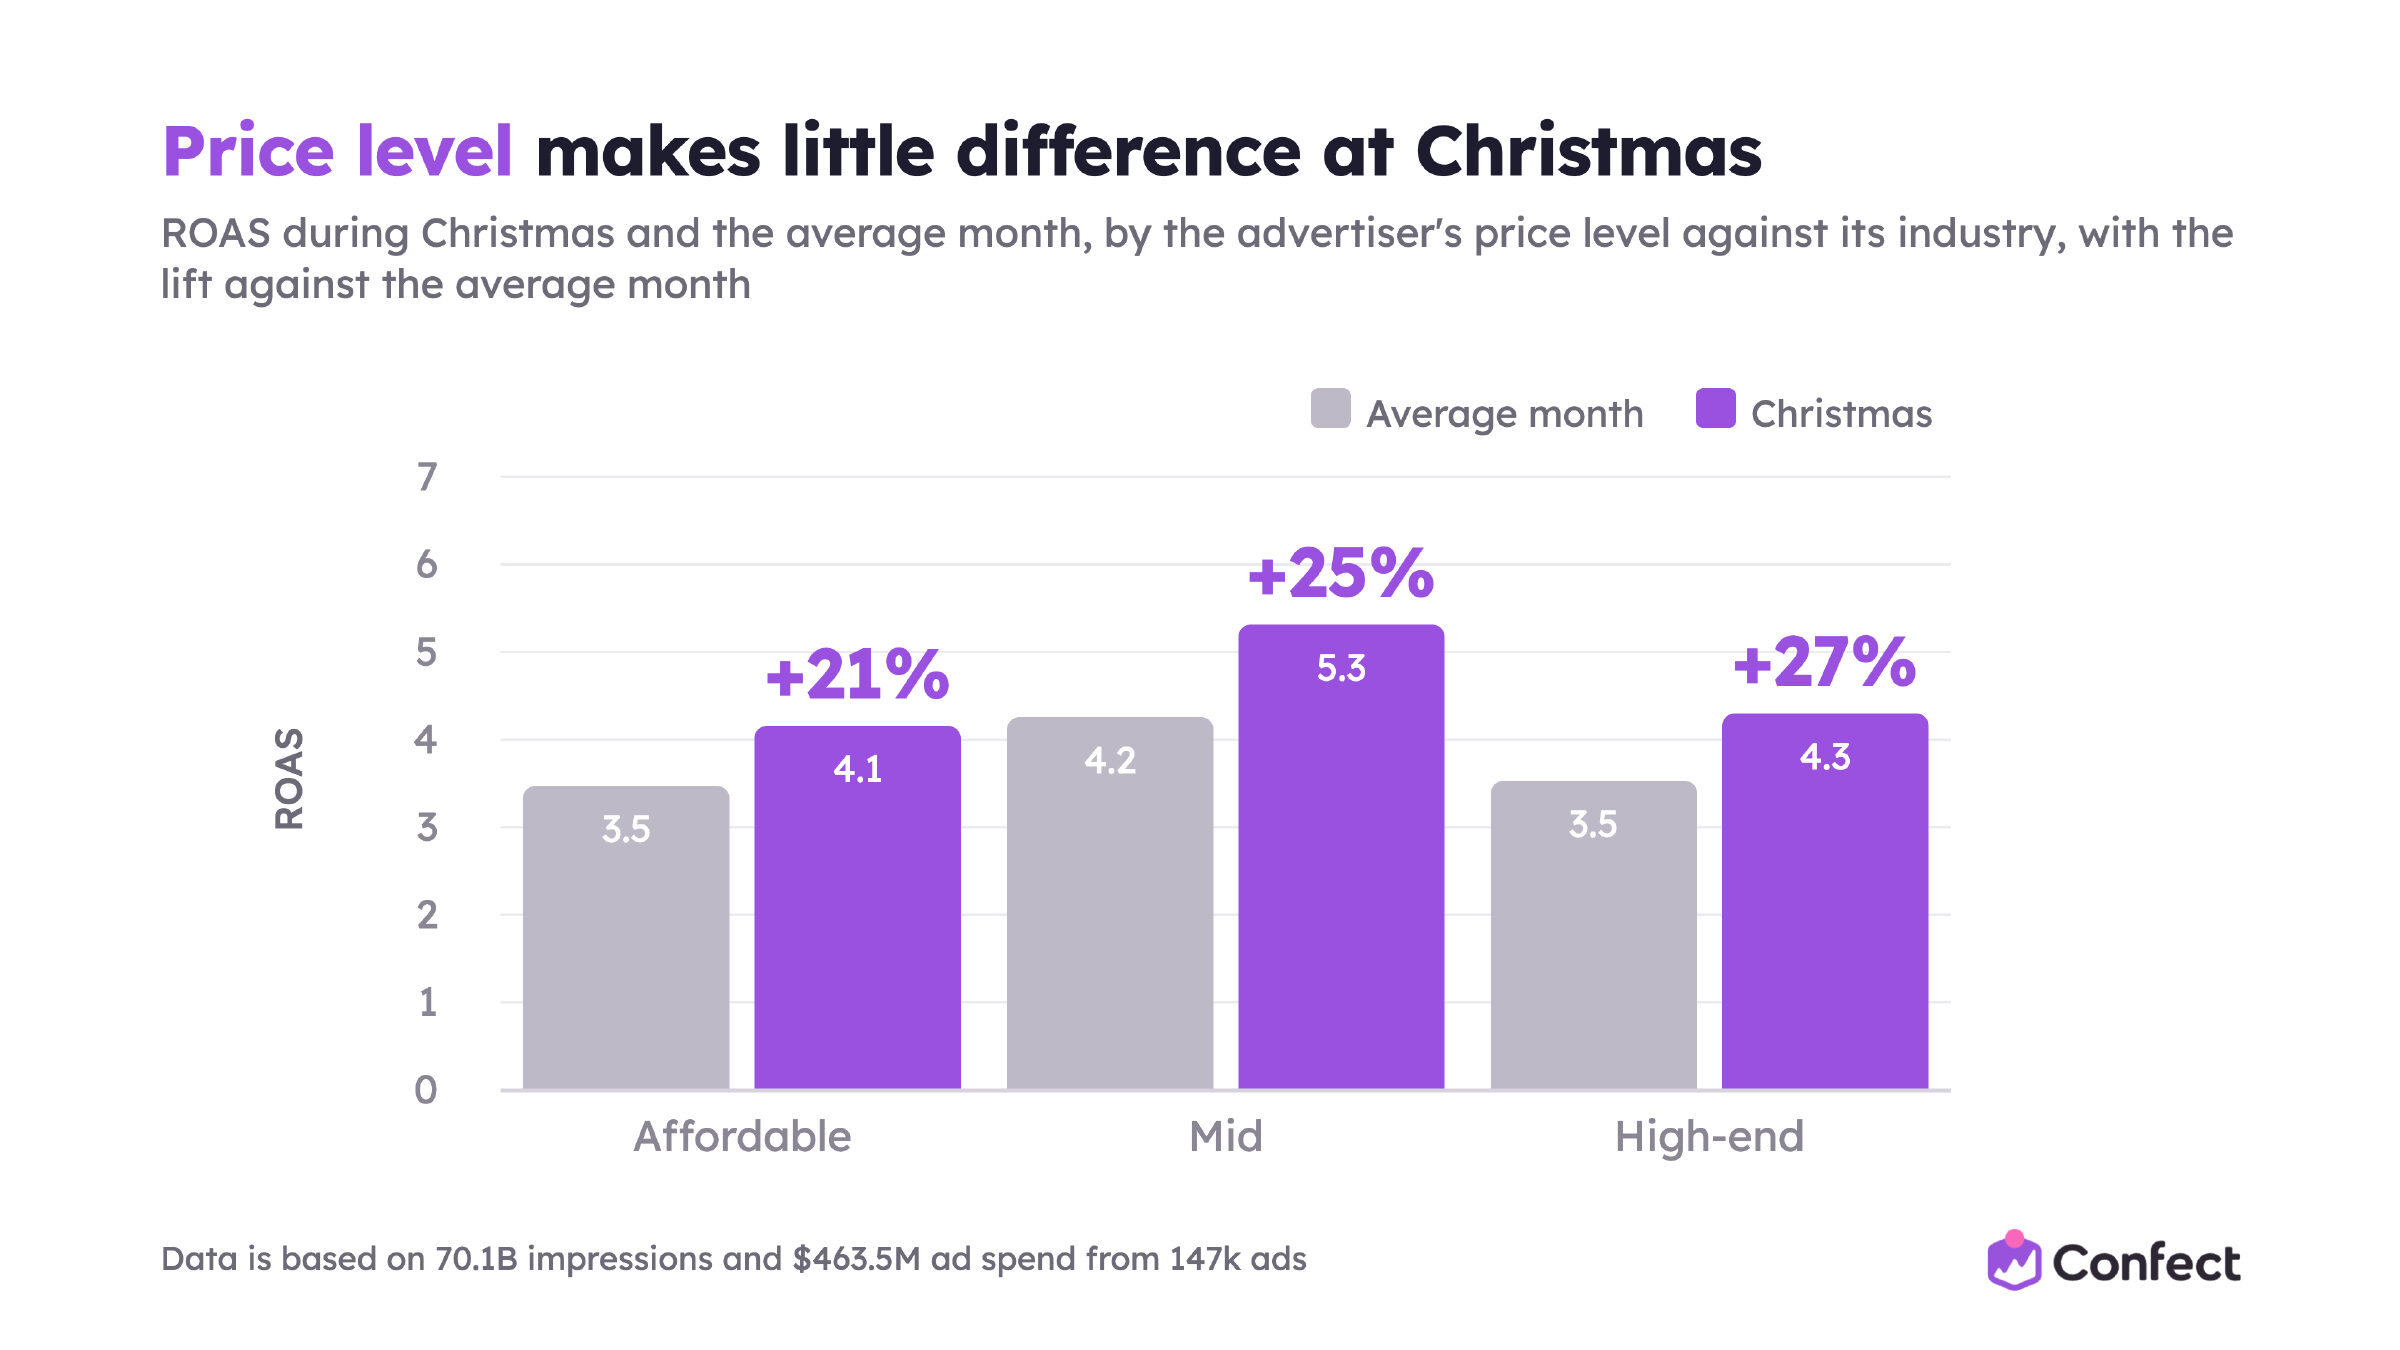
Half of the shops with orders under $100 are mid or high-end priced for their industry, and a third of the shops with orders above $200 are affordable. A high-end sock shop and an affordable sofa shop are both in the data.
How the winners set up their account
The shops that get the most out of Christmas do not look very different from the shops that get the most out of any month. They run the whole funnel, they commit to Catalog Ads, and they give the algorithm a lot to work with.
Keep both funnels running
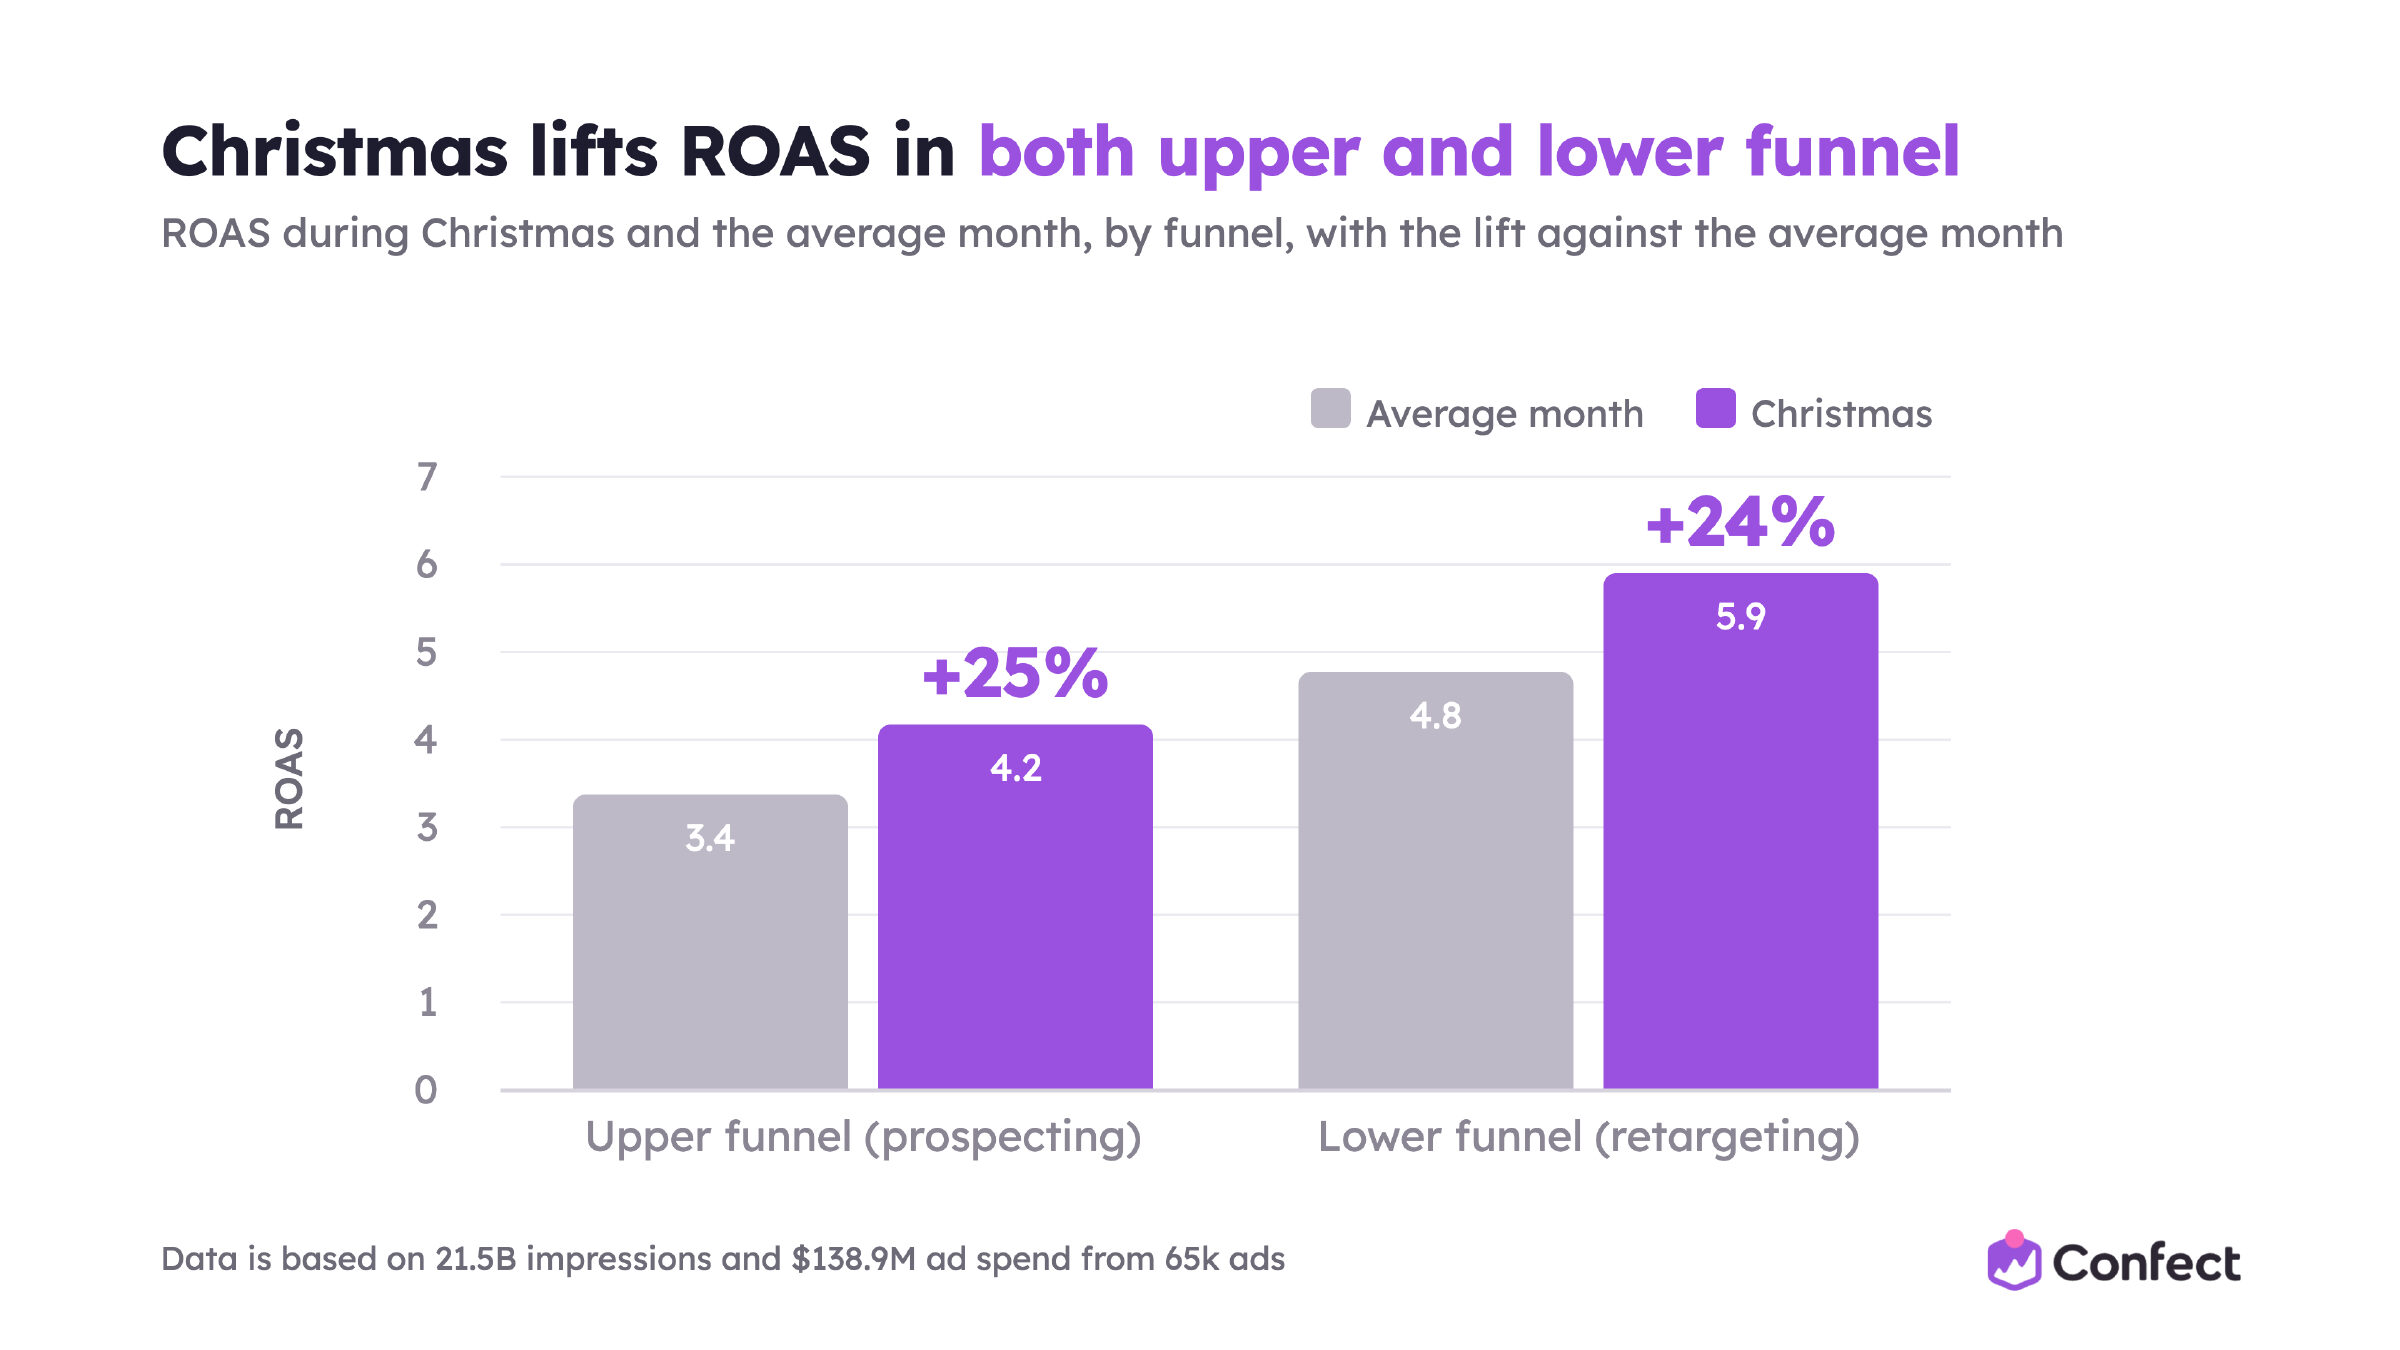
Prospecting and retargeting both return about 25% more at Christmas. Upper funnel is up 25%, lower funnel 24%.
That matters because the obvious Christmas move is to pull budget into retargeting, where the people who already know you are. The data says do not.
Retargeting pays the biggest CPM increase of all, 24%, because everyone else has the same idea. Prospecting, meanwhile, is where the gift buyer who has never heard of you finds the thing they did not know they were looking for. New shoppers pay off as well as returning ones in December.
Do not let the absolute numbers fool you either. Retargeting runs the higher ROAS at Christmas, 5.9 against 4.2 in prospecting, but it does that every month of the year (4.8 against 3.4 in the average month).
The retargeting pool only holds people who have already visited, and in December every other shop they visited is bidding on them too. Add budget there and you mostly buy the same people again at a higher price. Prospecting is the only place your audience gets bigger, and in December it is full of people with a gift list and nothing on it from you yet.
Run traffic campaigns next to your Catalog Ads
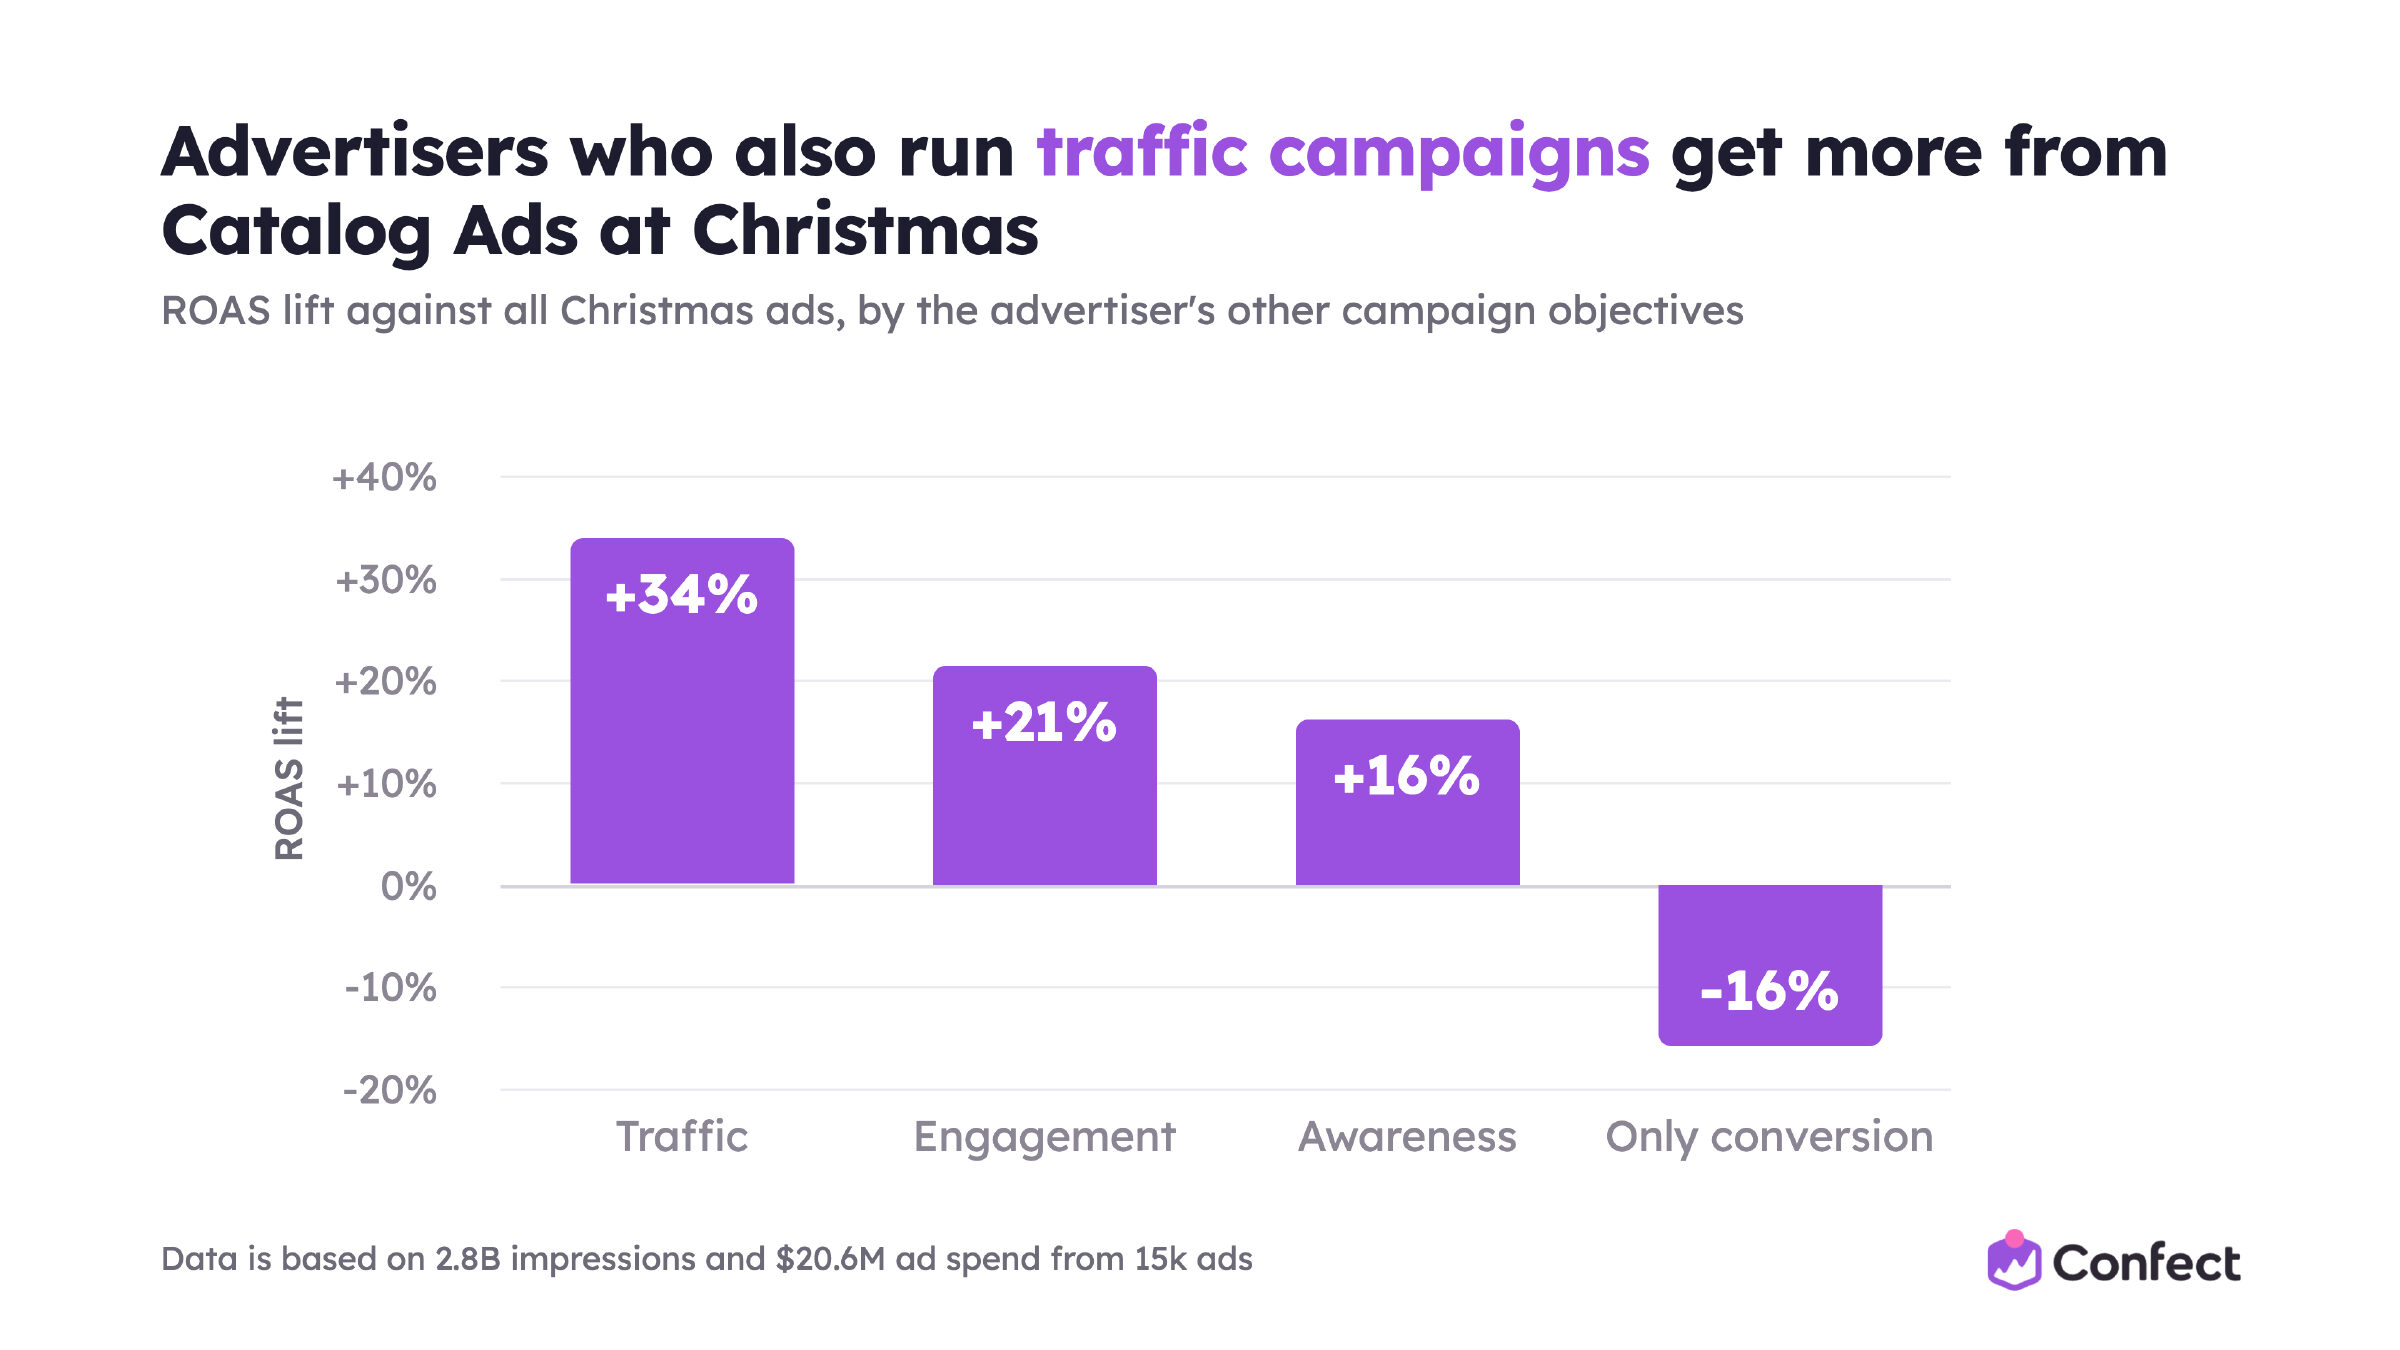
Advertisers who also run traffic campaigns get 34% more from their Catalog Ads than the typical Christmas advertiser. Engagement campaigns go with a 21% lift and awareness with 16%. Advertisers running conversion campaigns only return 16% less.
We should be honest about what this is. It is not proof that a traffic campaign causes a better Catalog Ad. Advertisers who invest in the whole funnel are often bigger and more experienced. Read it as a description of what the winners' setup looks like, and it is almost certainly true outside Christmas too. Our recollection is that the whole-funnel advantage is slightly larger in a normal month, so December narrows it a little without removing it.
There is a mechanism behind it, though, and it is the same one that explains the mental availability work from the Ehrenberg-Bass Institute: a brand has to come to mind in the buying situation. A traffic campaign in November puts you on the shortlist. A Catalog Ad in December closes the sale.
Commit to Catalog Ads
Advertisers who spend over two thirds of their Meta budget on Catalog Ads return 11% more than the typical Christmas ad. Those between a third and two thirds return about the same as everyone. Those under a third return less.
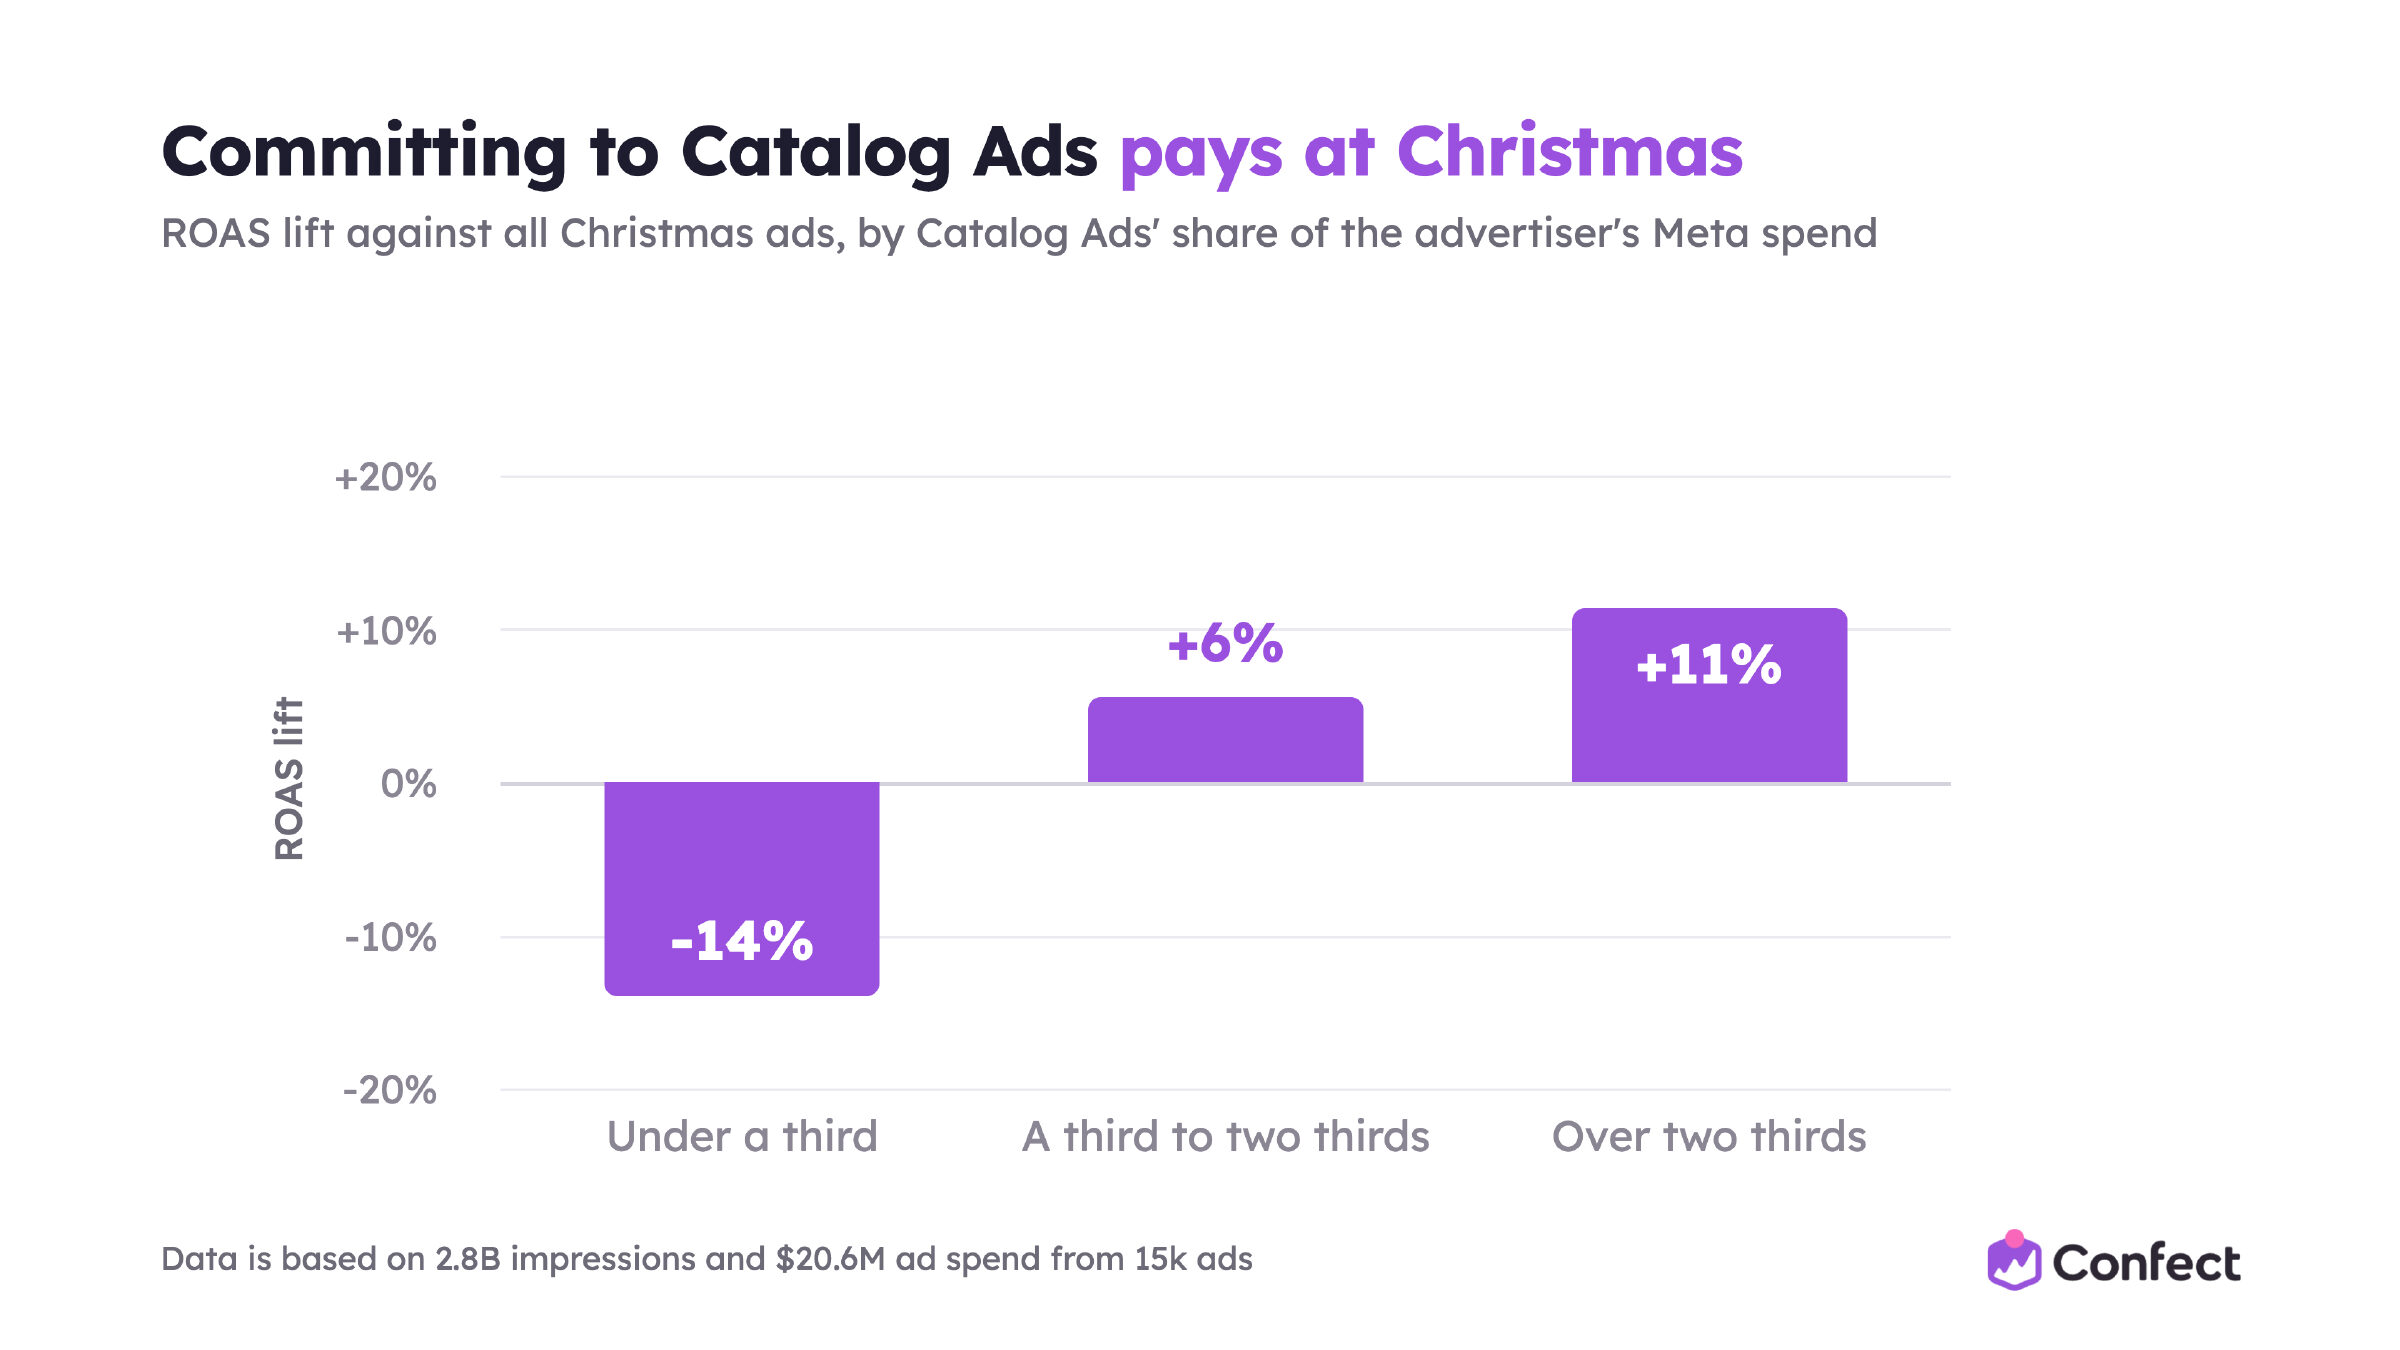
The hard line is at one third. Below it, Catalog Ads are a side project in the account, and they perform like one. Above it, the algorithm has enough spend and enough signals to find the right products for the right people.
Bigger catalogs win, and you can still do something about it
Shops with over 2,000 products return 28% more in prospecting and 15% more in retargeting than the typical Christmas ad. Shops with under 500 products return 34% less in prospecting and 23% less in retargeting.
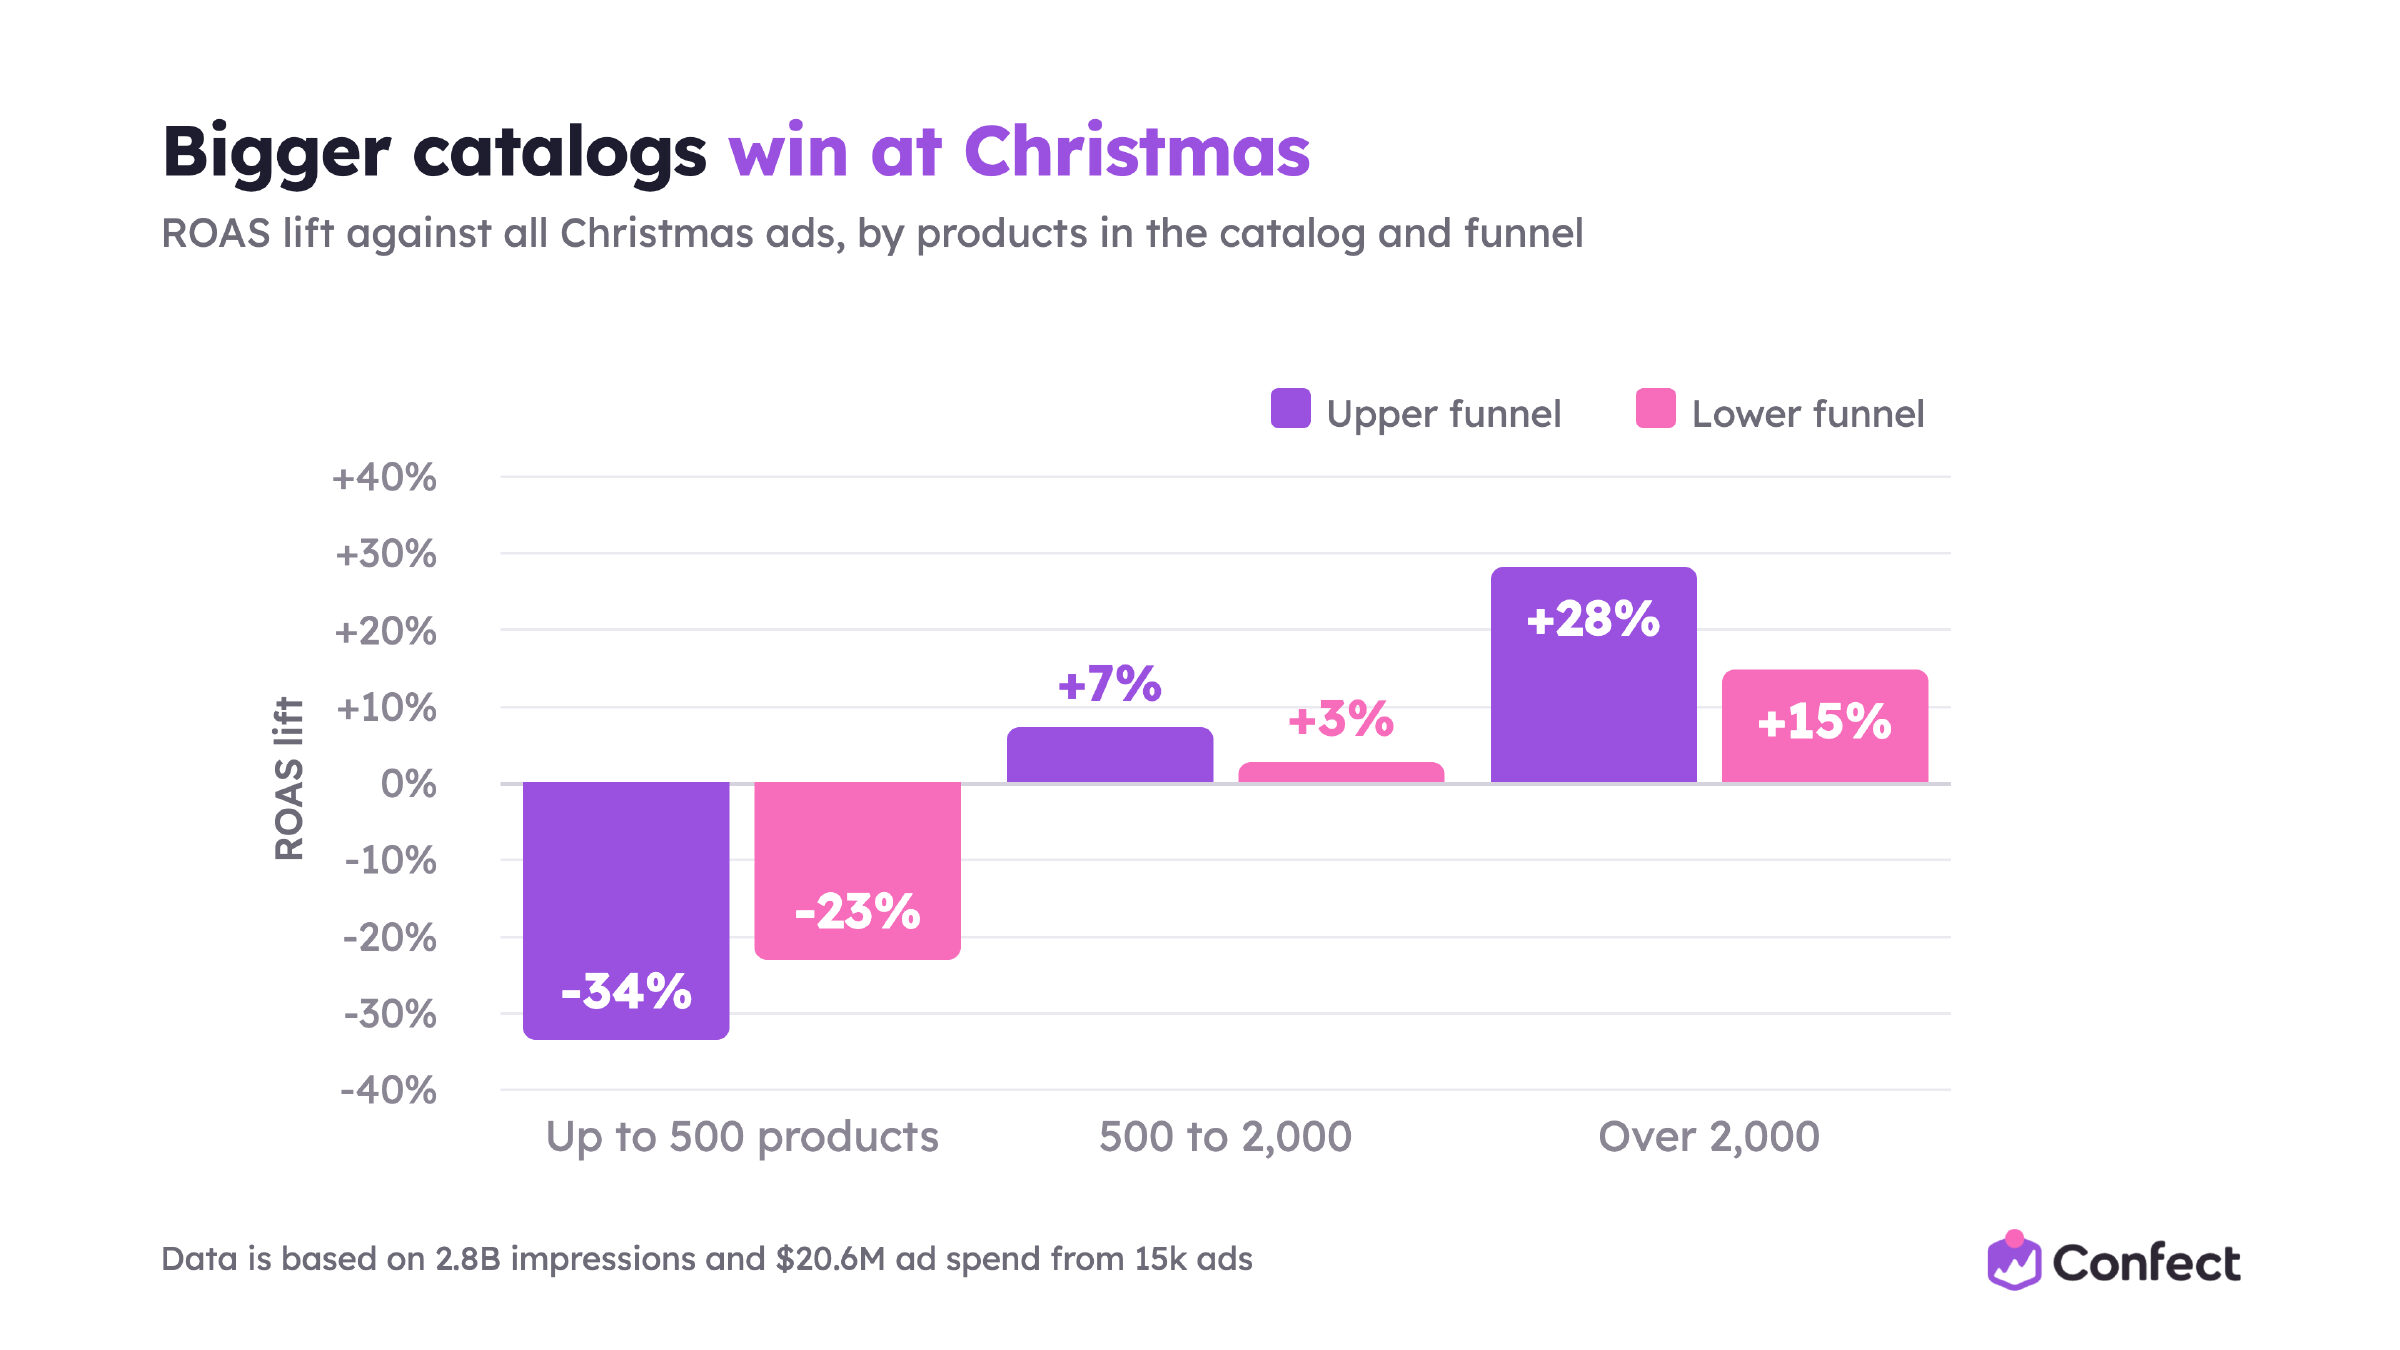
This is an annoying finding, because you cannot add 1,500 products in time for December. But it is less about the size of your catalog than about the size of your catalog in the ad.
A Catalog Ad works by matching each shopper to the product they are most likely to buy. The more products Meta can choose from, the better the match.
So the practical version of this finding is: make sure the whole catalog is in your data source and eligible for the ad, not a curated set of 40 bestsellers. At Christmas, the long tail is where the odd, specific gift lives.
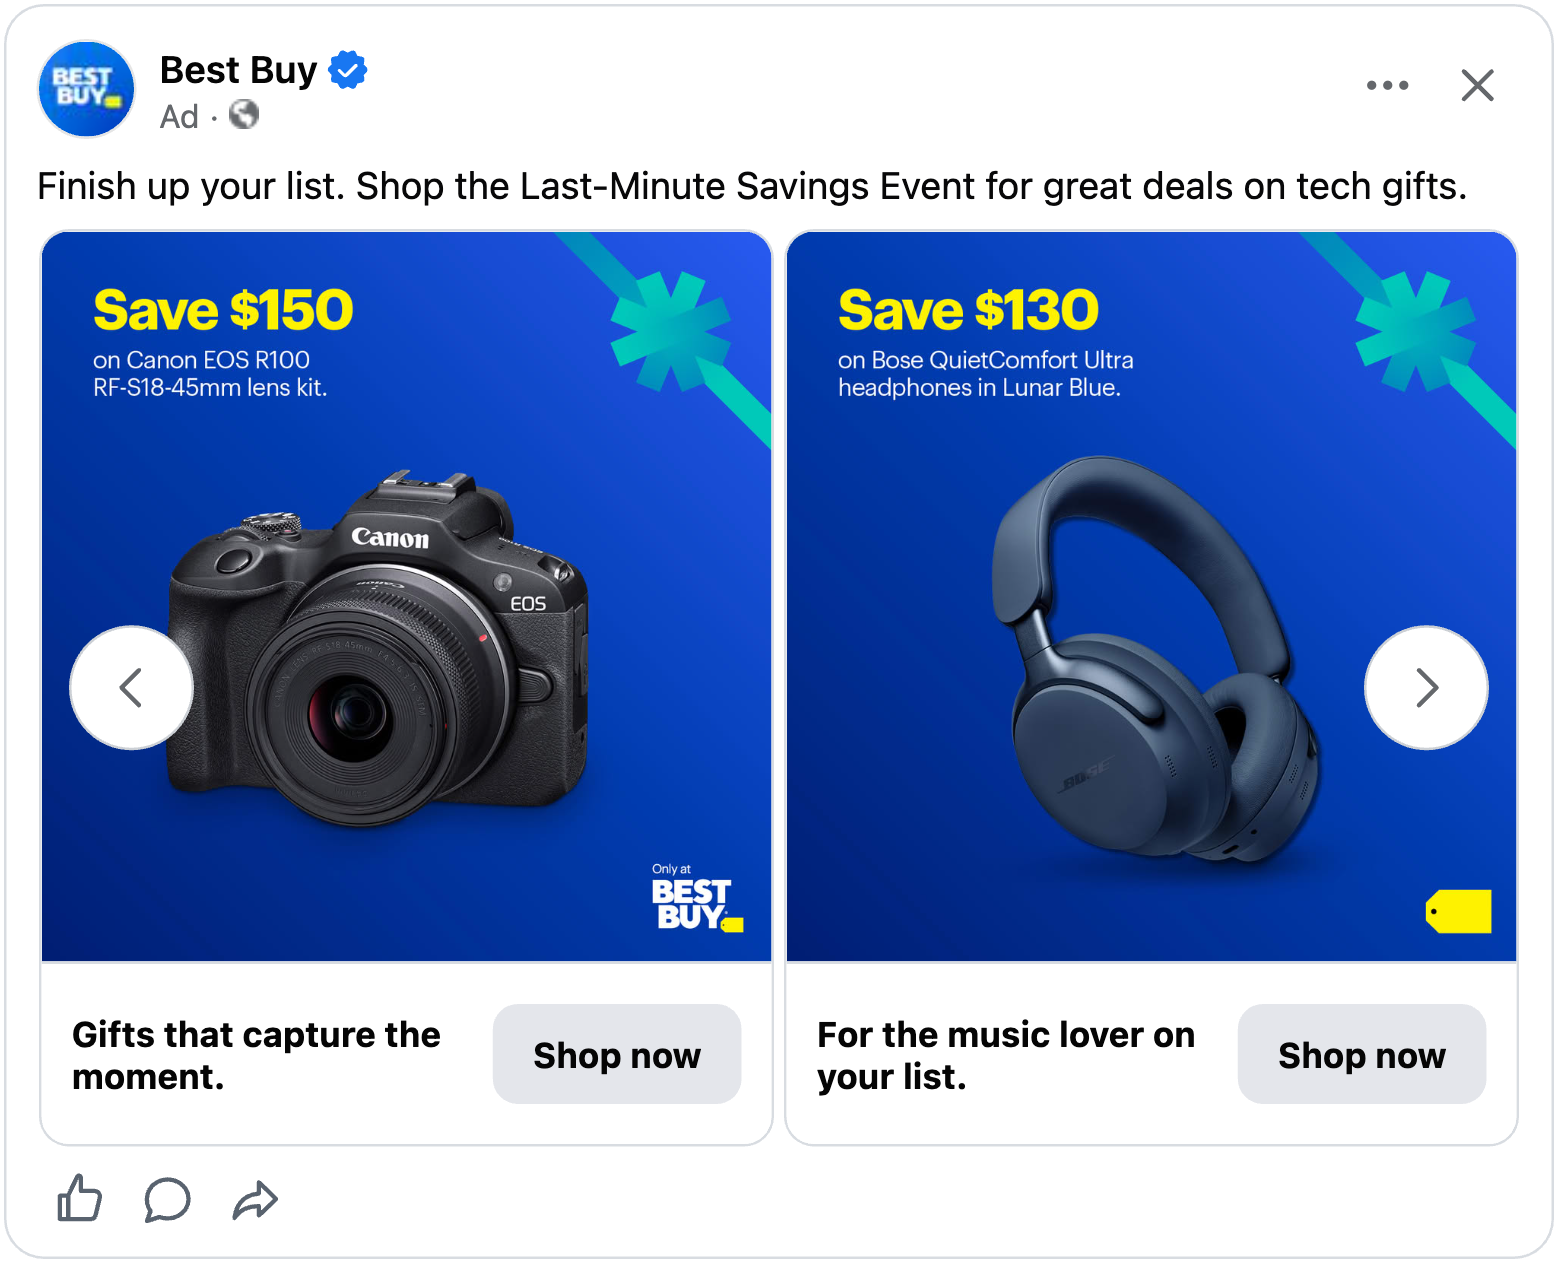
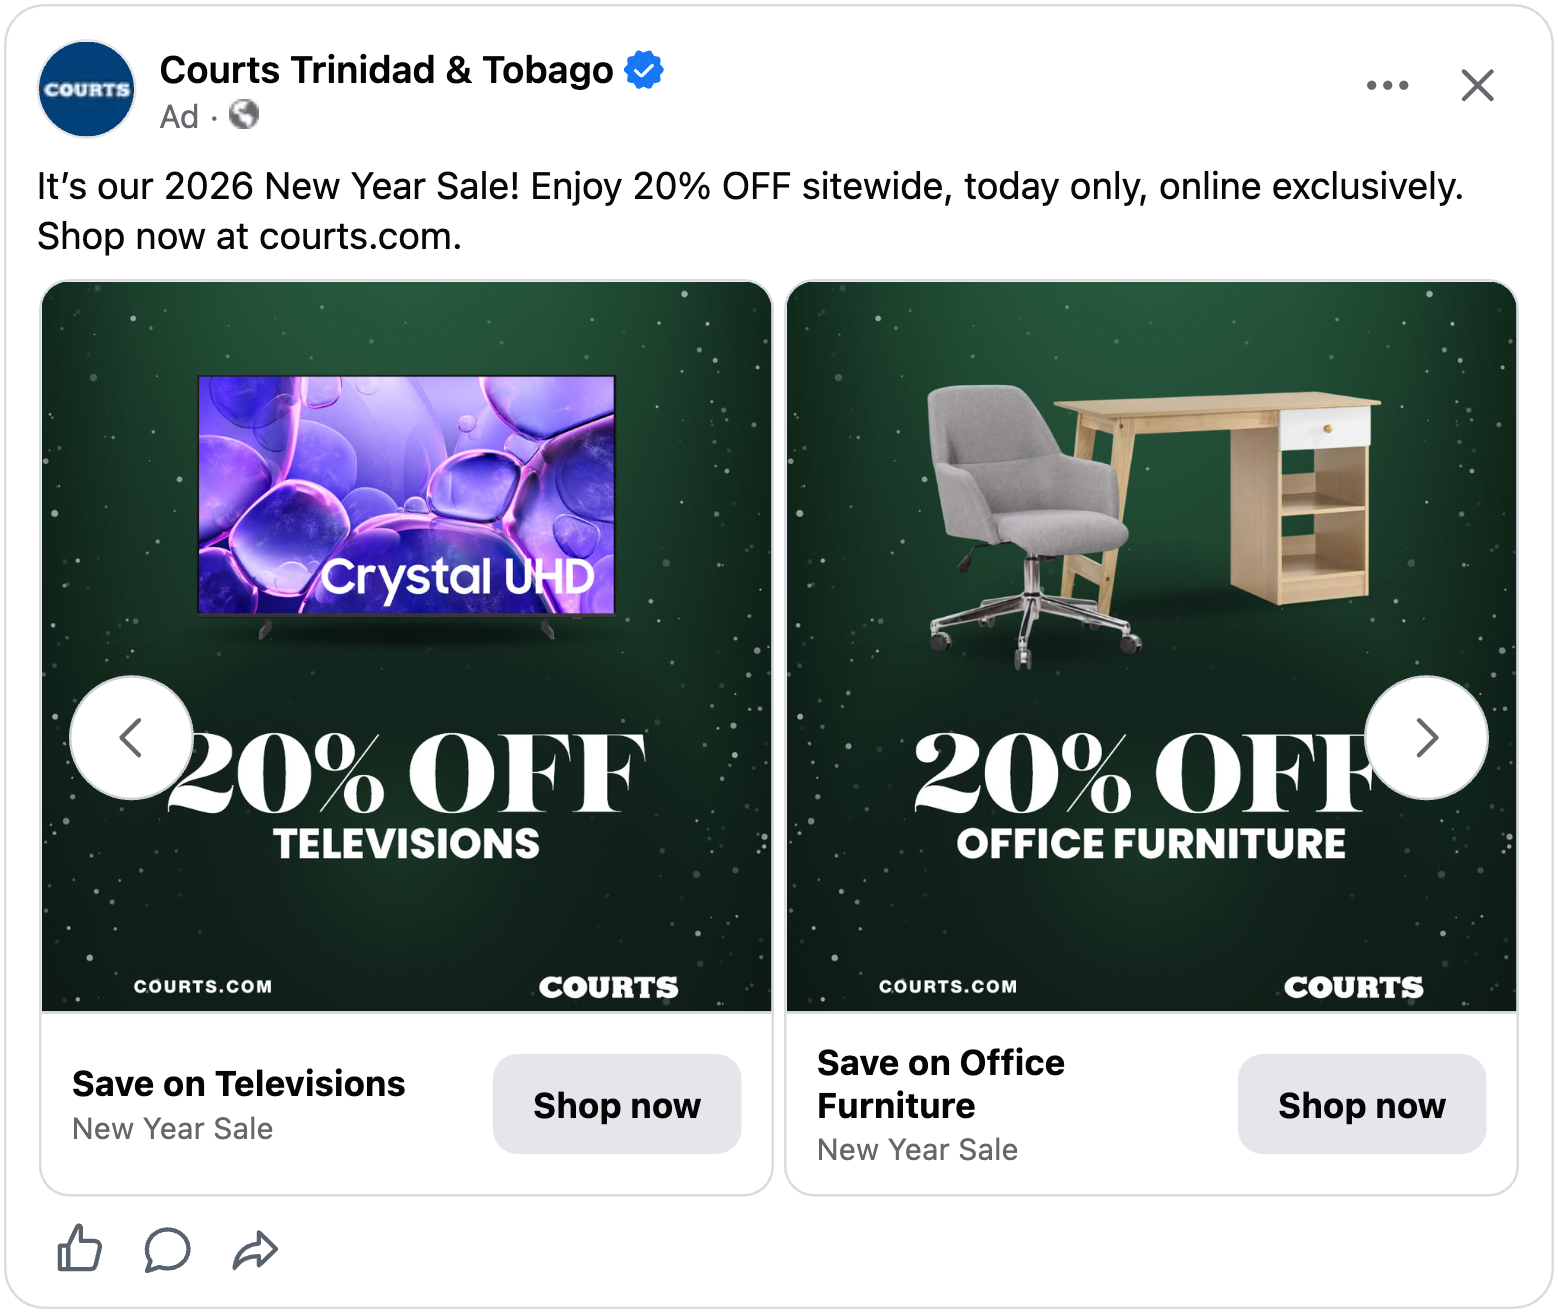
The Best Buy ad above shows what that breadth buys. Every card is one specific product for one specific person: $150 off a Canon camera for “gifts that capture the moment”, $130 off Bose headphones “for the music lover on your list”. A Catalog Ad built on 40 products cannot make that match for every name on a shopper’s list. One built on 4,000 can.
And the penalty sits at the bottom. Catalogs between 500 and 2,000 products already land above the typical Christmas ad in prospecting (+7%). It is the shops under 500 that pay for a short catalog.
Give every ad several design versions
Ads with six designs in the variant return 45% more than the typical Christmas ad. Ads with one design return about the same as everyone. Ads with no design at all return 12% less. Every extra design in between goes with a higher ROAS.
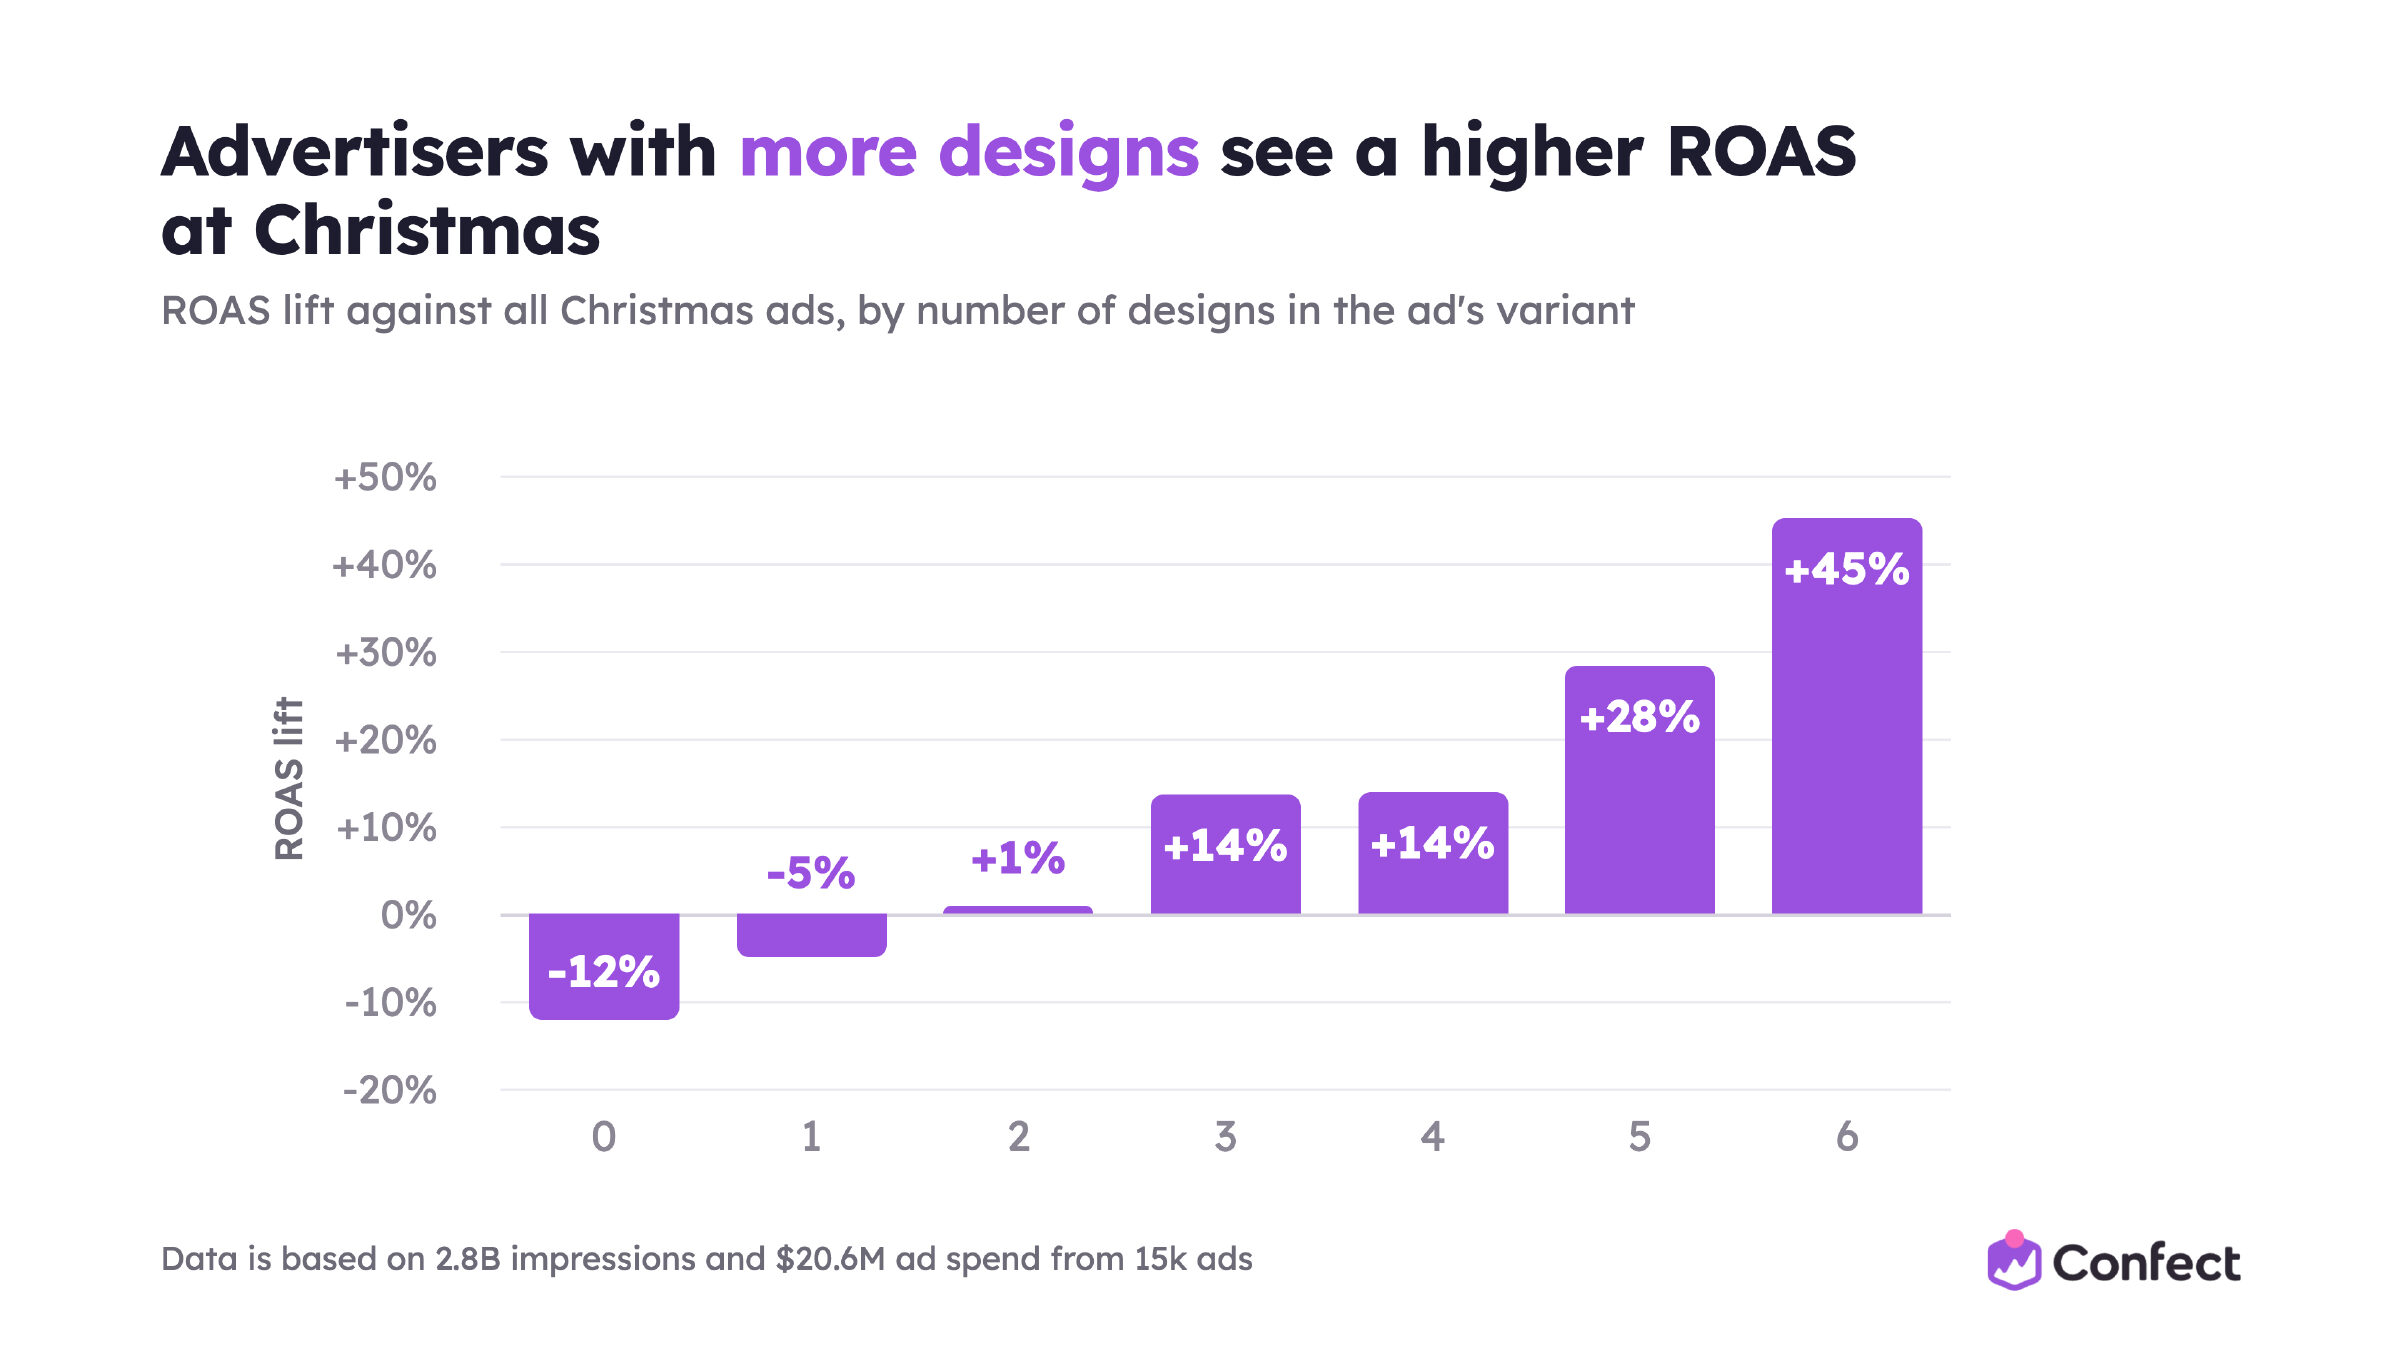
The reason is partly mechanical: Meta treats each design as a separate creative, so six designs give the algorithm six chances to find one that works for a given shopper. And it is partly about learning. With several versions running, you find out which elements work for your shop specifically, instead of trusting the average of 1,332 shops. We will come back to this at the end of the design section, because it is the biggest creative point in the study.
Design: what to put in the ad when the shopper is buying for someone else
This is where Christmas stops behaving like Black Month.
In November, the deal is the message. Strike out the old price, show the saving, and the shopper who already wanted the product buys it. In December, the shopper often does not know what they want. They know who it is for. And the question in their head is not "is this cheap enough" but "will this land".
So the design elements that reduce that doubt gain value, and the elements that only sweeten the price lose it.
How we group the elements
We tag every Catalog Ad design with the elements it shows. For this section we group them:
- Trust: ratings, reviews, guarantees and quality promises.
- New: a product marked as new.
- Discount: original price, sale discount, savings amount.
- Visuals: extra product images, Product Assets, seasonal visuals, animation, video.
- Product info: price, category, colour, size, material, description, USP.
- Shipping: free shipping, shipping terms, delivery speed.
- Voucher: a voucher code in the design.
An ad counts in every group it matches, so the groups overlap. That is fine. Nobody designs with one element.
Any design element beats none
Let us start with the baseline. An ad with no design elements at all returns 9% less than the typical Christmas ad. Every group beats that: new products +16%, trust +14%, visuals +8%, discount +8%, product info +3%. Shipping is flat.
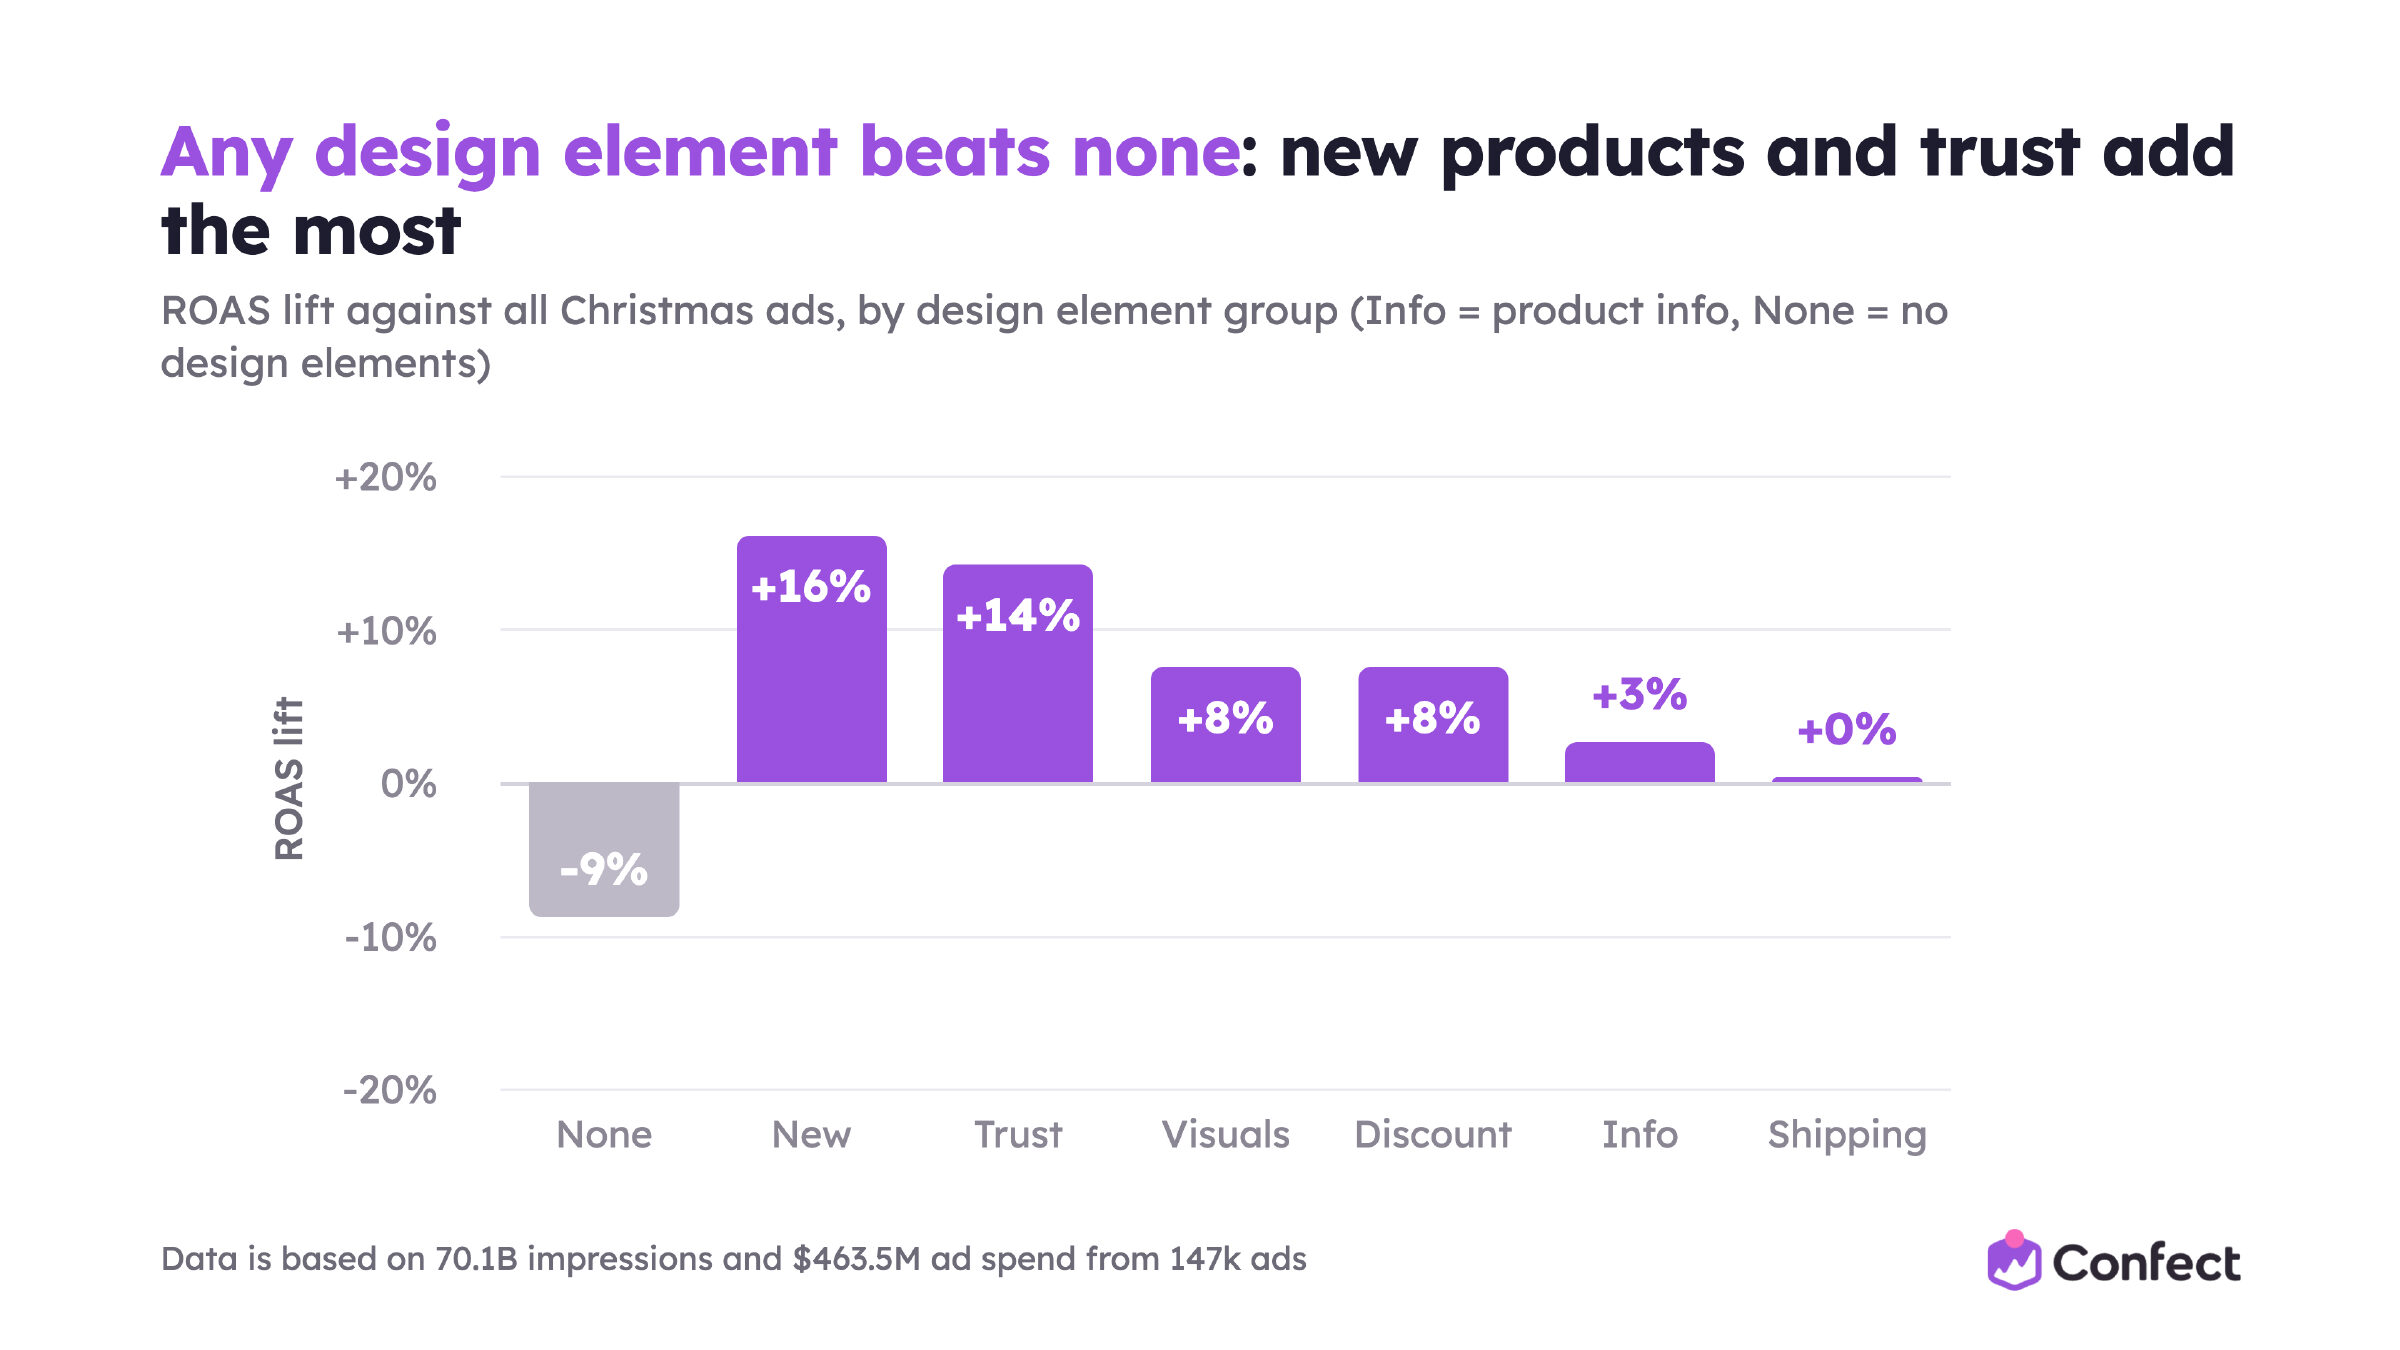
Trust is the only group that rises from the average month to Christmas, from +7% to +14%. Discounts still help, but their edge shrinks by more than half, from +19% to +8%.
New products still lead the chart at Christmas, and gifts give them an extra job. The worst gift is one the person already owns, and “new” answers that worry before the shopper has to ask it.
At the other end, an ad with no design elements is a product on a white background, which is exactly what the shop in the next tab is showing too. When the shopper is choosing between shops, it gives them nothing to choose you on.
Why trust pays when you buy for someone else
Three ideas from marketing theory explain the whole pattern, and they are worth having in your head before you look at the element-by-element charts.
Perceived risk. A gift carries two risks a normal purchase does not: performance risk (will it work, will it fit, will it arrive) and social risk (what does this gift say about me). Ratings, reviews and guarantees lower both.
Trust transfer. Shoppers borrow trust from what they already know: a brand, a shop, other buyers. A known brand gets it for free. An unknown shop has to show it in the ad.
Transaction utility. Richard Thaler's idea that part of the pleasure of buying is the deal itself. In the average month, "was $80, now $50" is a reason to buy. At Christmas the gift is the point, and the saving is nice but not the reason. That is why discount elements keep working, just less.
The map: how each element moves from the average month to Christmas
We plotted every design element twice: its ROAS lift against all ads in the average month, and its lift against all ads at Christmas. Elements above the diagonal do better in a normal month. Elements below it do better at Christmas.
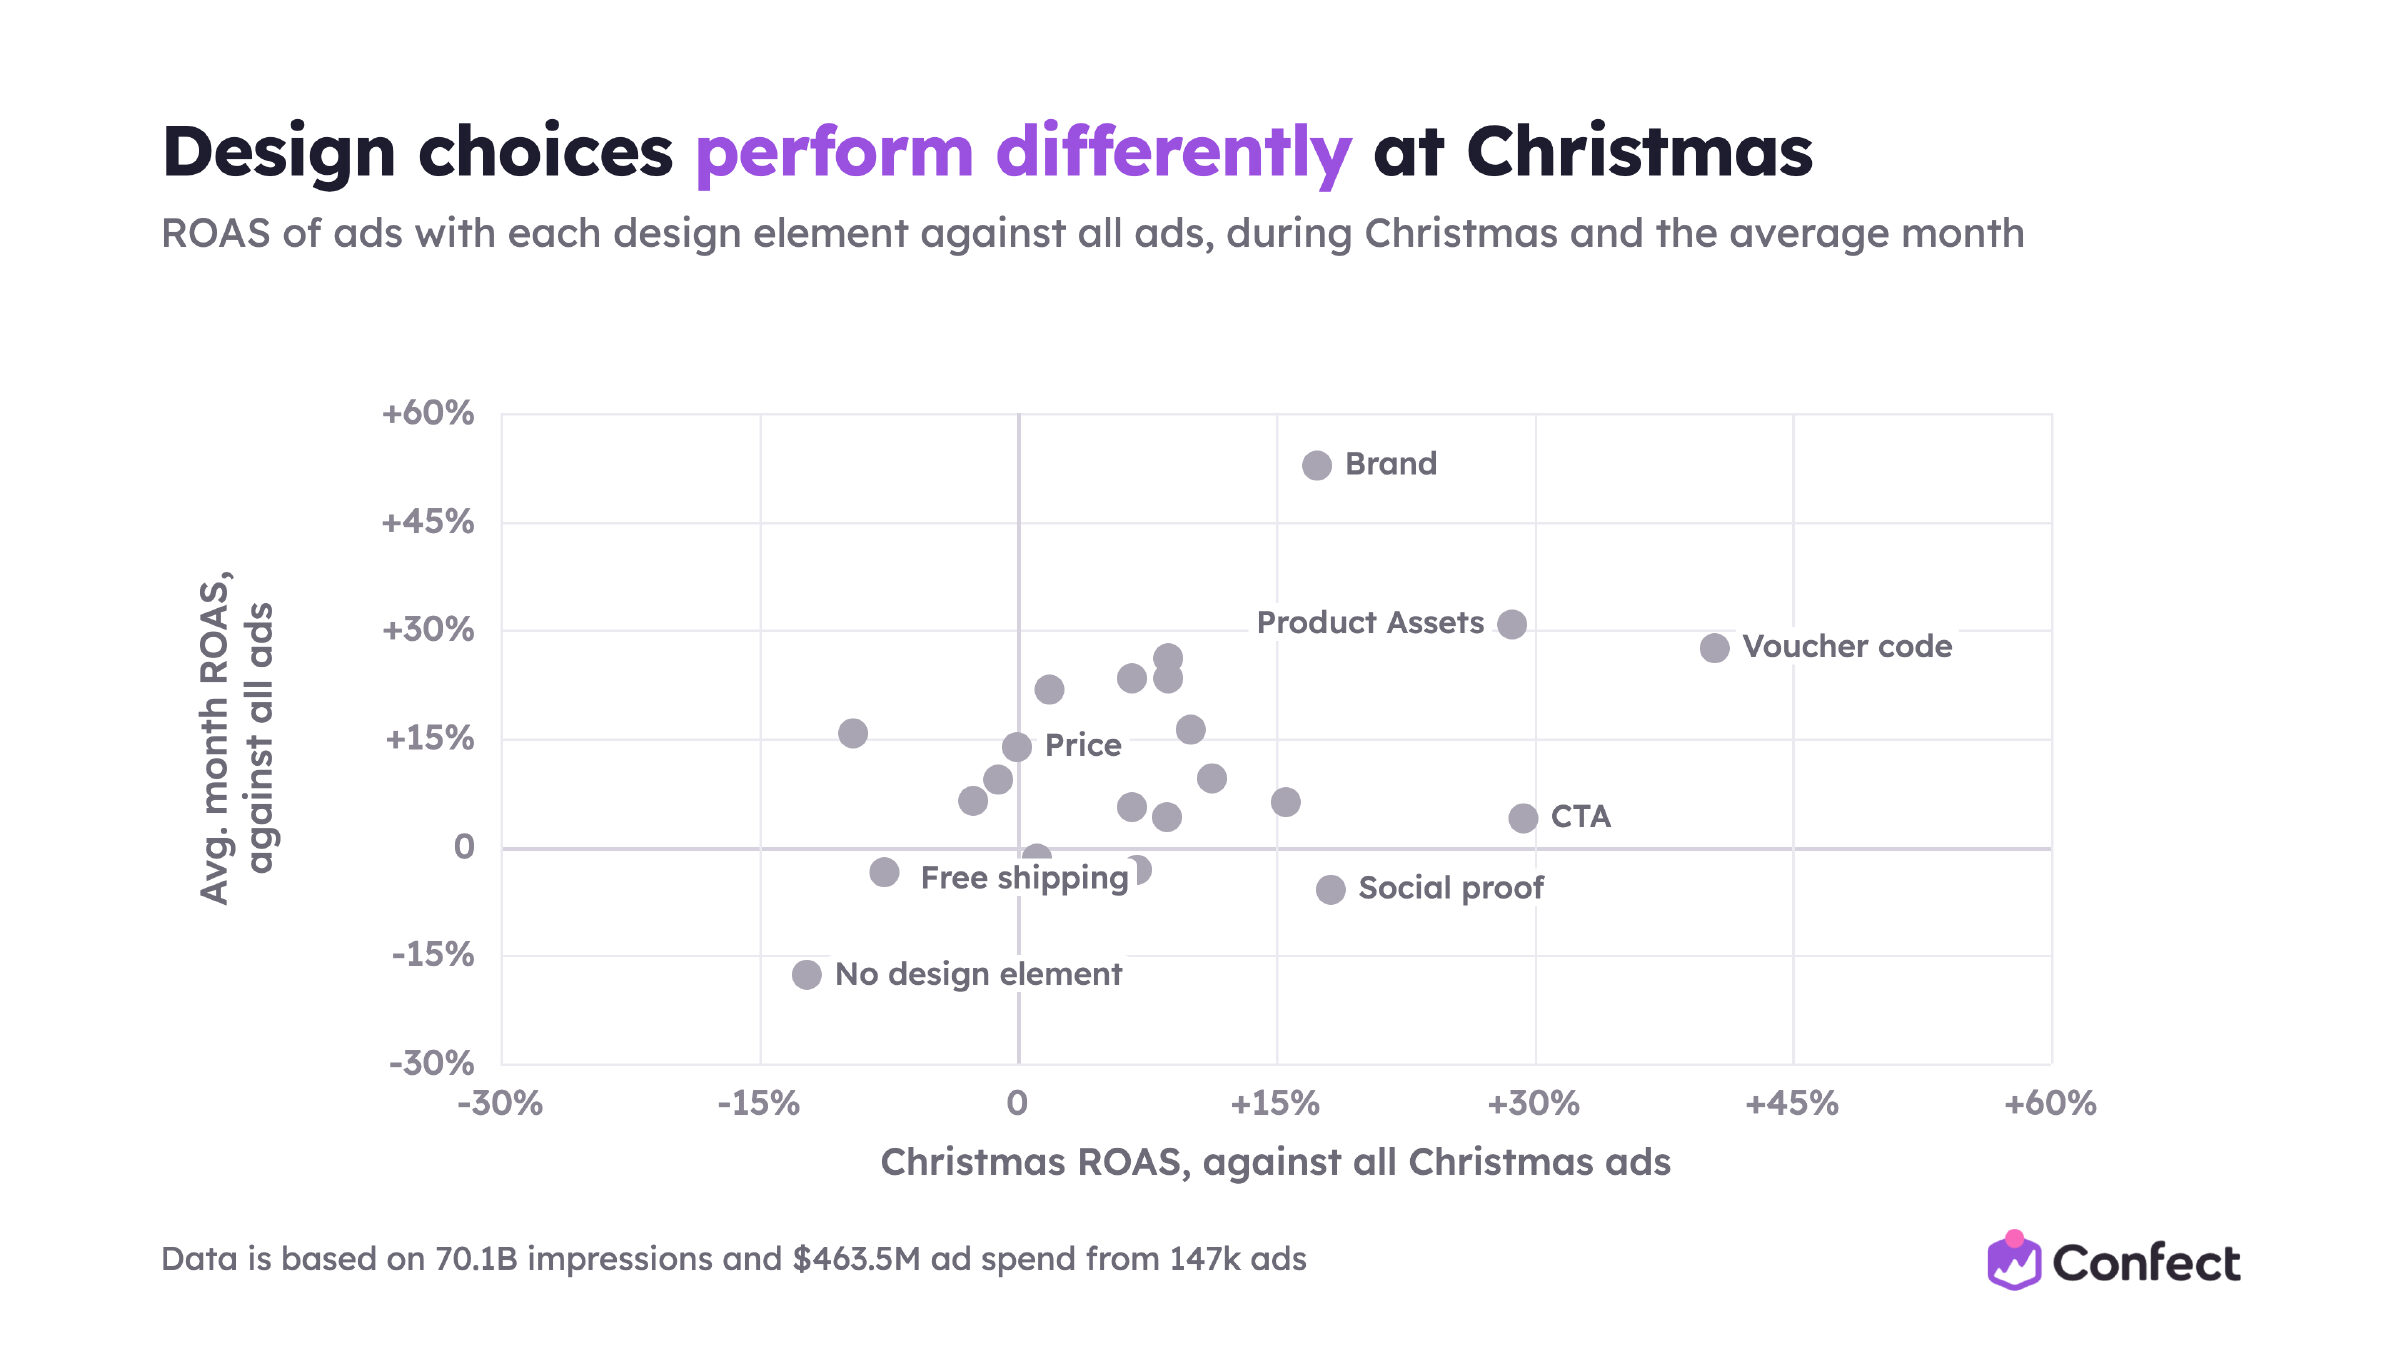
Most elements sit close to the line. The ones that move are the story.
Read it in two directions. The further right a dot sits, the more it is worth at Christmas. The higher it sits, the more it is worth the rest of the year.
Four dots are worth finding before you read on. Voucher code sits furthest right of all. The call to action and social proof both sit around zero on the vertical axis and far out on the horizontal one: little in a normal month, a lot at Christmas. Product Assets sits high and right, good in both. And “no design element” sits bottom left, the worst place to be in either period.
Social proof starts to pay when the shopper is buying a gift
In the average month, ads with ratings or reviews return 6% less than the typical ad. At Christmas they return 18% more. That is the biggest swing of any element with a solid sample.
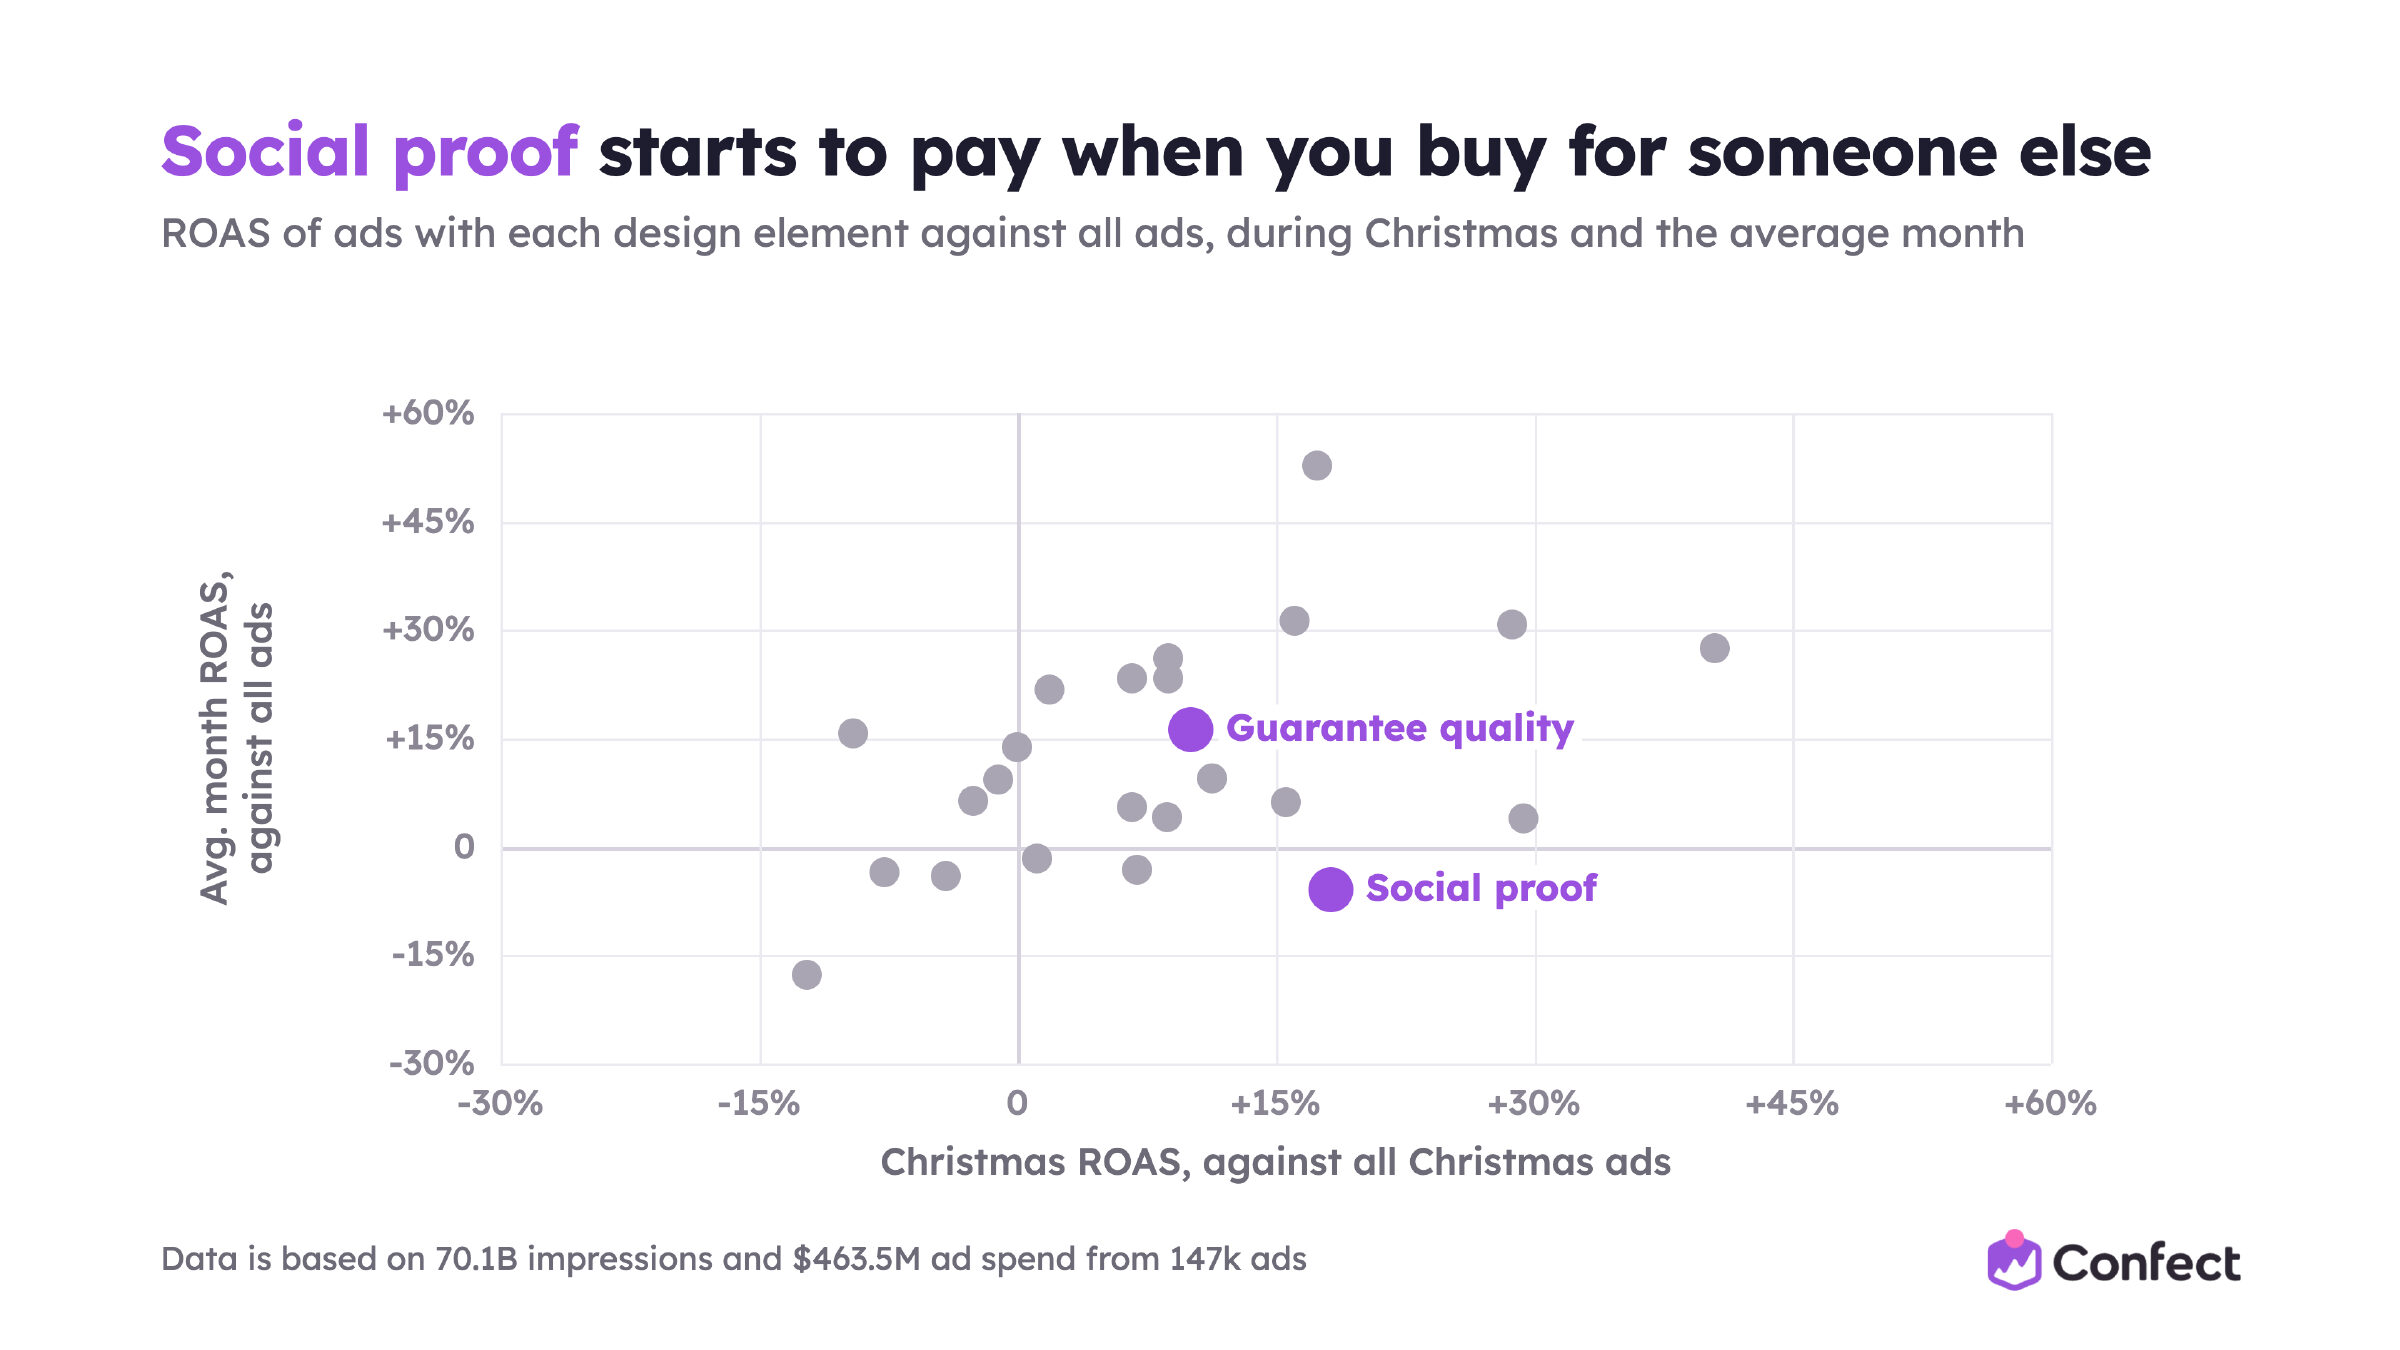
It is Cialdini's social proof doing exactly what he said it would. People copy the actions of others when they are uncertain, and nobody is more uncertain than someone buying headphones for a teenager they see twice a year. "4.8 stars from 2,400 buyers" tells them the teenager will probably like it.
Guarantees and quality promises are positive in both periods (+16% in the average month, +10% at Christmas), so they are not a Christmas story on their own. They are just always worth having.

Laptops Clearance shows how to put it in the design. Every product carries the same red bar: 3000+ reviews, a 5/5 Google review score and a 5/5 Facebook review score. The headline adds a three-year warranty. A laptop is about as high-risk as a gift gets, and the shop is not a household name, so it borrows trust from a few thousand strangers instead.
Notice that the bar is identical on every product. You do not need product-level ratings in your data source to do this. A shop-level score, designed once, travels with every product in the catalog.
And show the count, not only the stars. Northwestern’s Spiegel Research Center found that a product with five reviews is 270% more likely to be bought than one with none. The number of people is the proof. The stars are the summary.
The deal matters less
Sale discount elements go from +26% in the average month to +9% at Christmas. Savings amounts go from +22% to +2%. Original price goes from +23% to +9%.
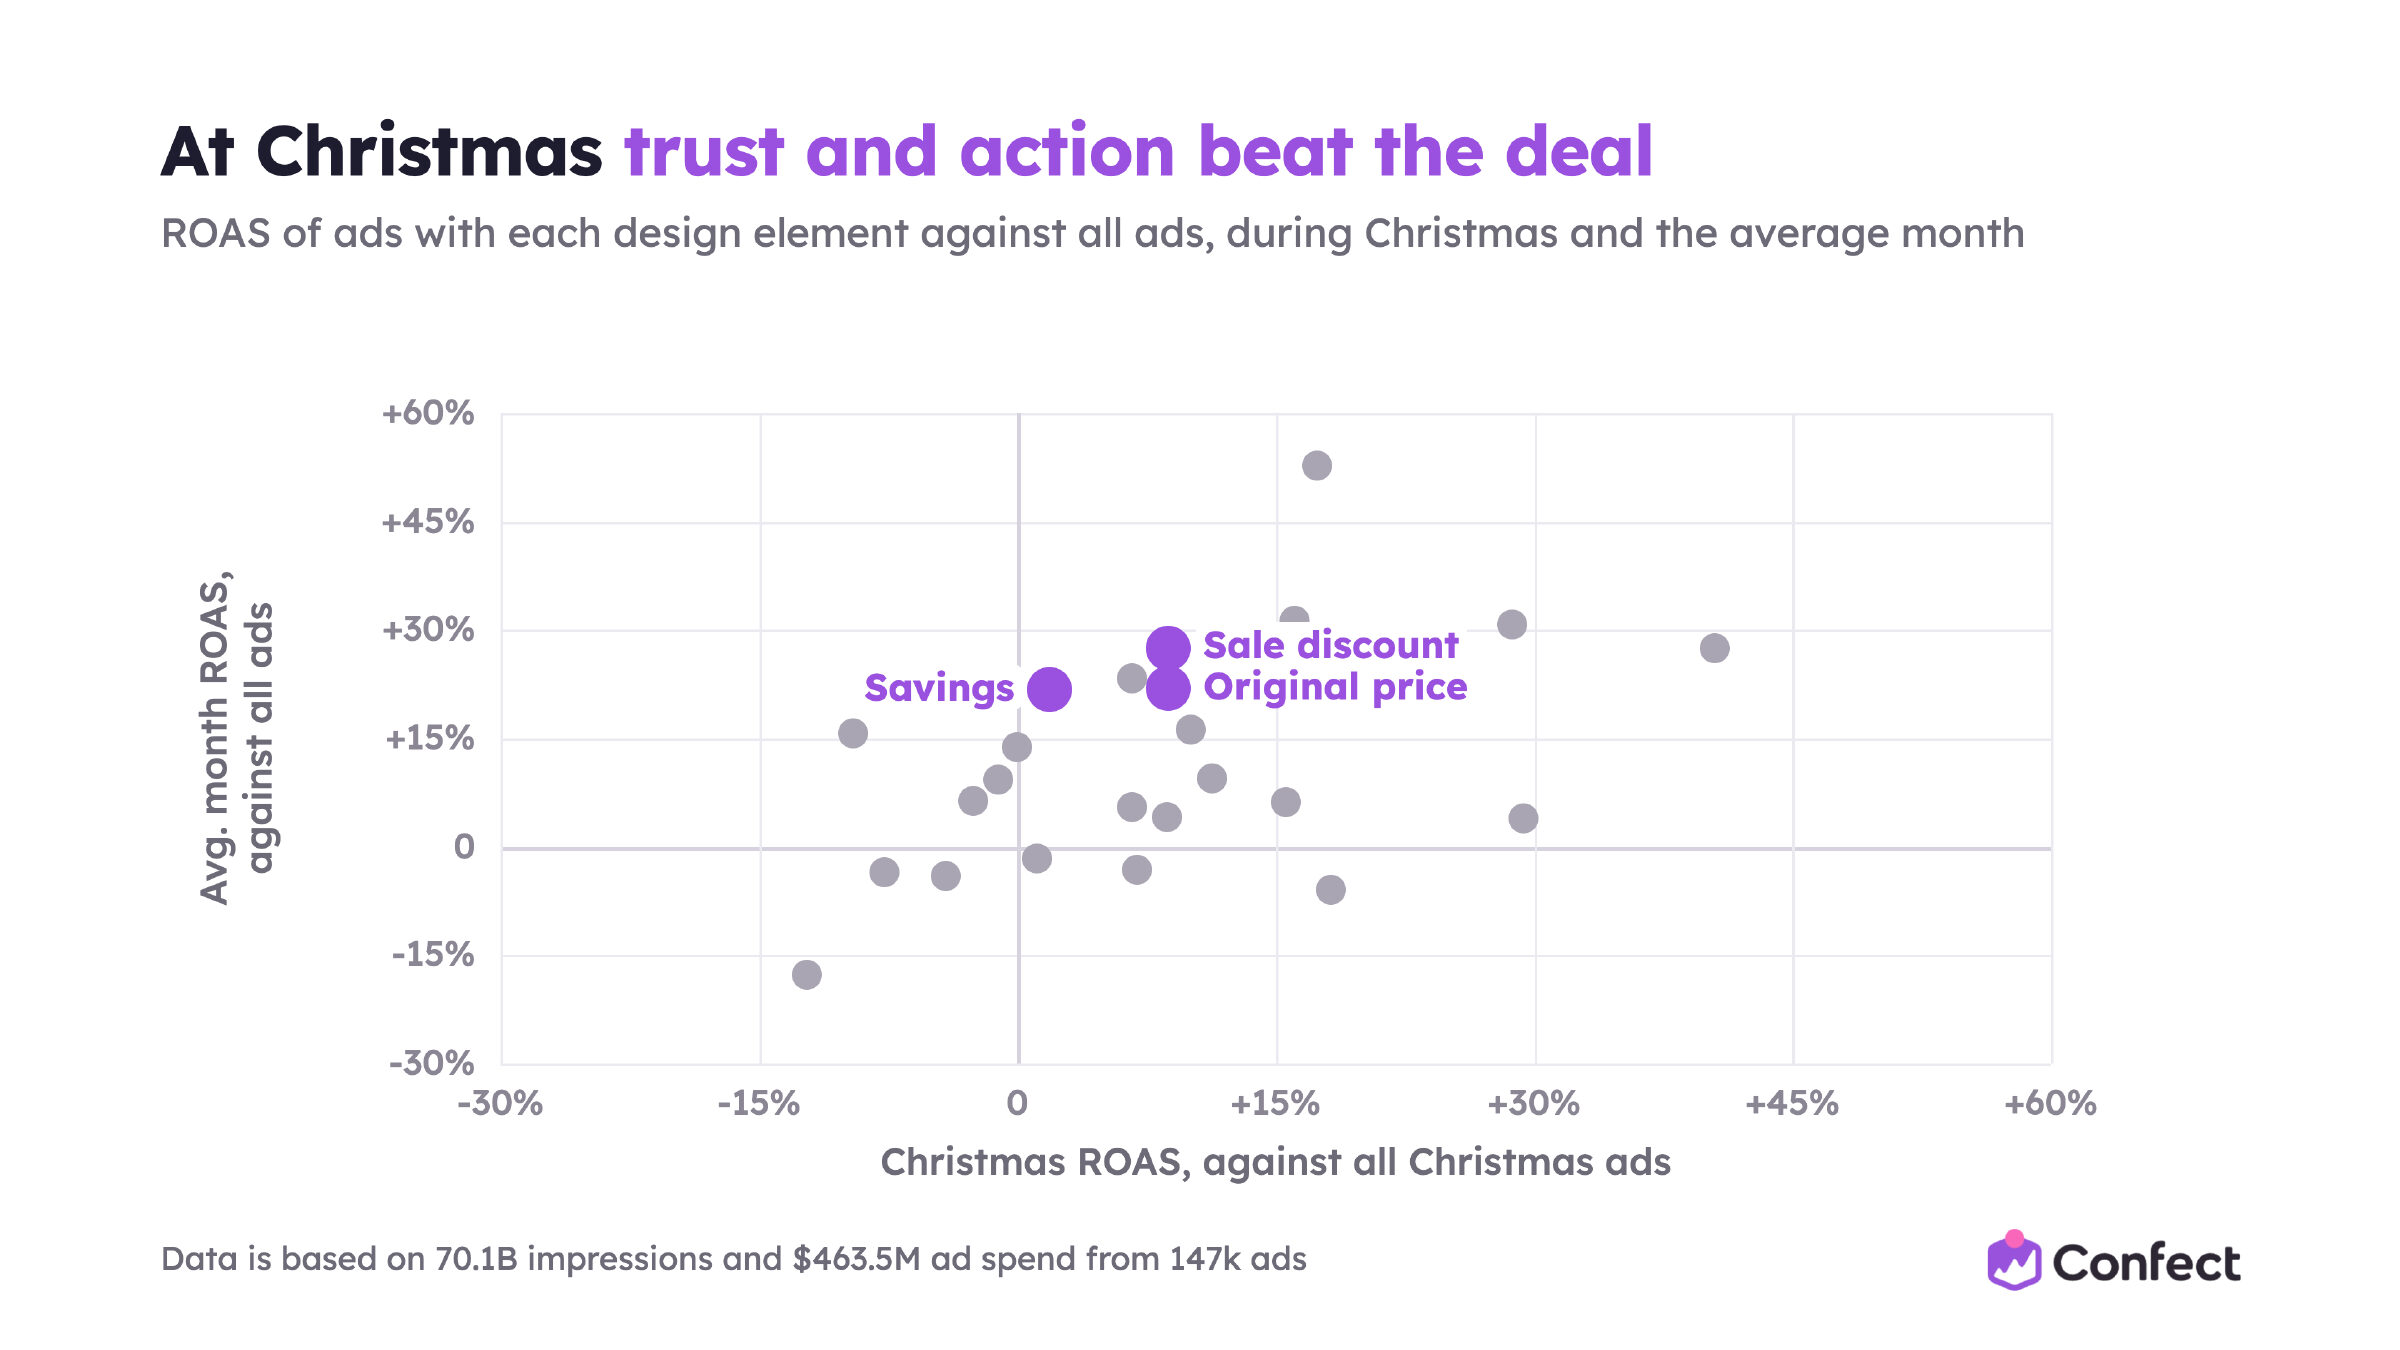
None of them turn negative. Showing the deal still beats not showing it. But if your Christmas design is a November design with a bow on it, you are leading with the thing that moves shoppers least in December.
There is a simple reason the saving shrinks. The gift buyer gets the discount, but the person who opens the gift never sees it. The price tag comes off before the wrapping goes on. So the saving makes the buyer feel clever and does nothing for the thing they are actually worried about: whether the gift lands.
The one exception is the voucher code, which goes up, from +27% to +40%. A code is not quite a discount. It is a small task with a reward at the end, and it gives the gift buyer a reason to buy here rather than from the next tab.

Glowral shows what that looks like in a Catalog Ad. The 25% is there, but the code does the work: “USE CODE WINTER25” in its own box, right above a “Shop Now” button drawn into the design. The shopper is not only told about a saving. They are handed something to use, and the button tells them where to use it.
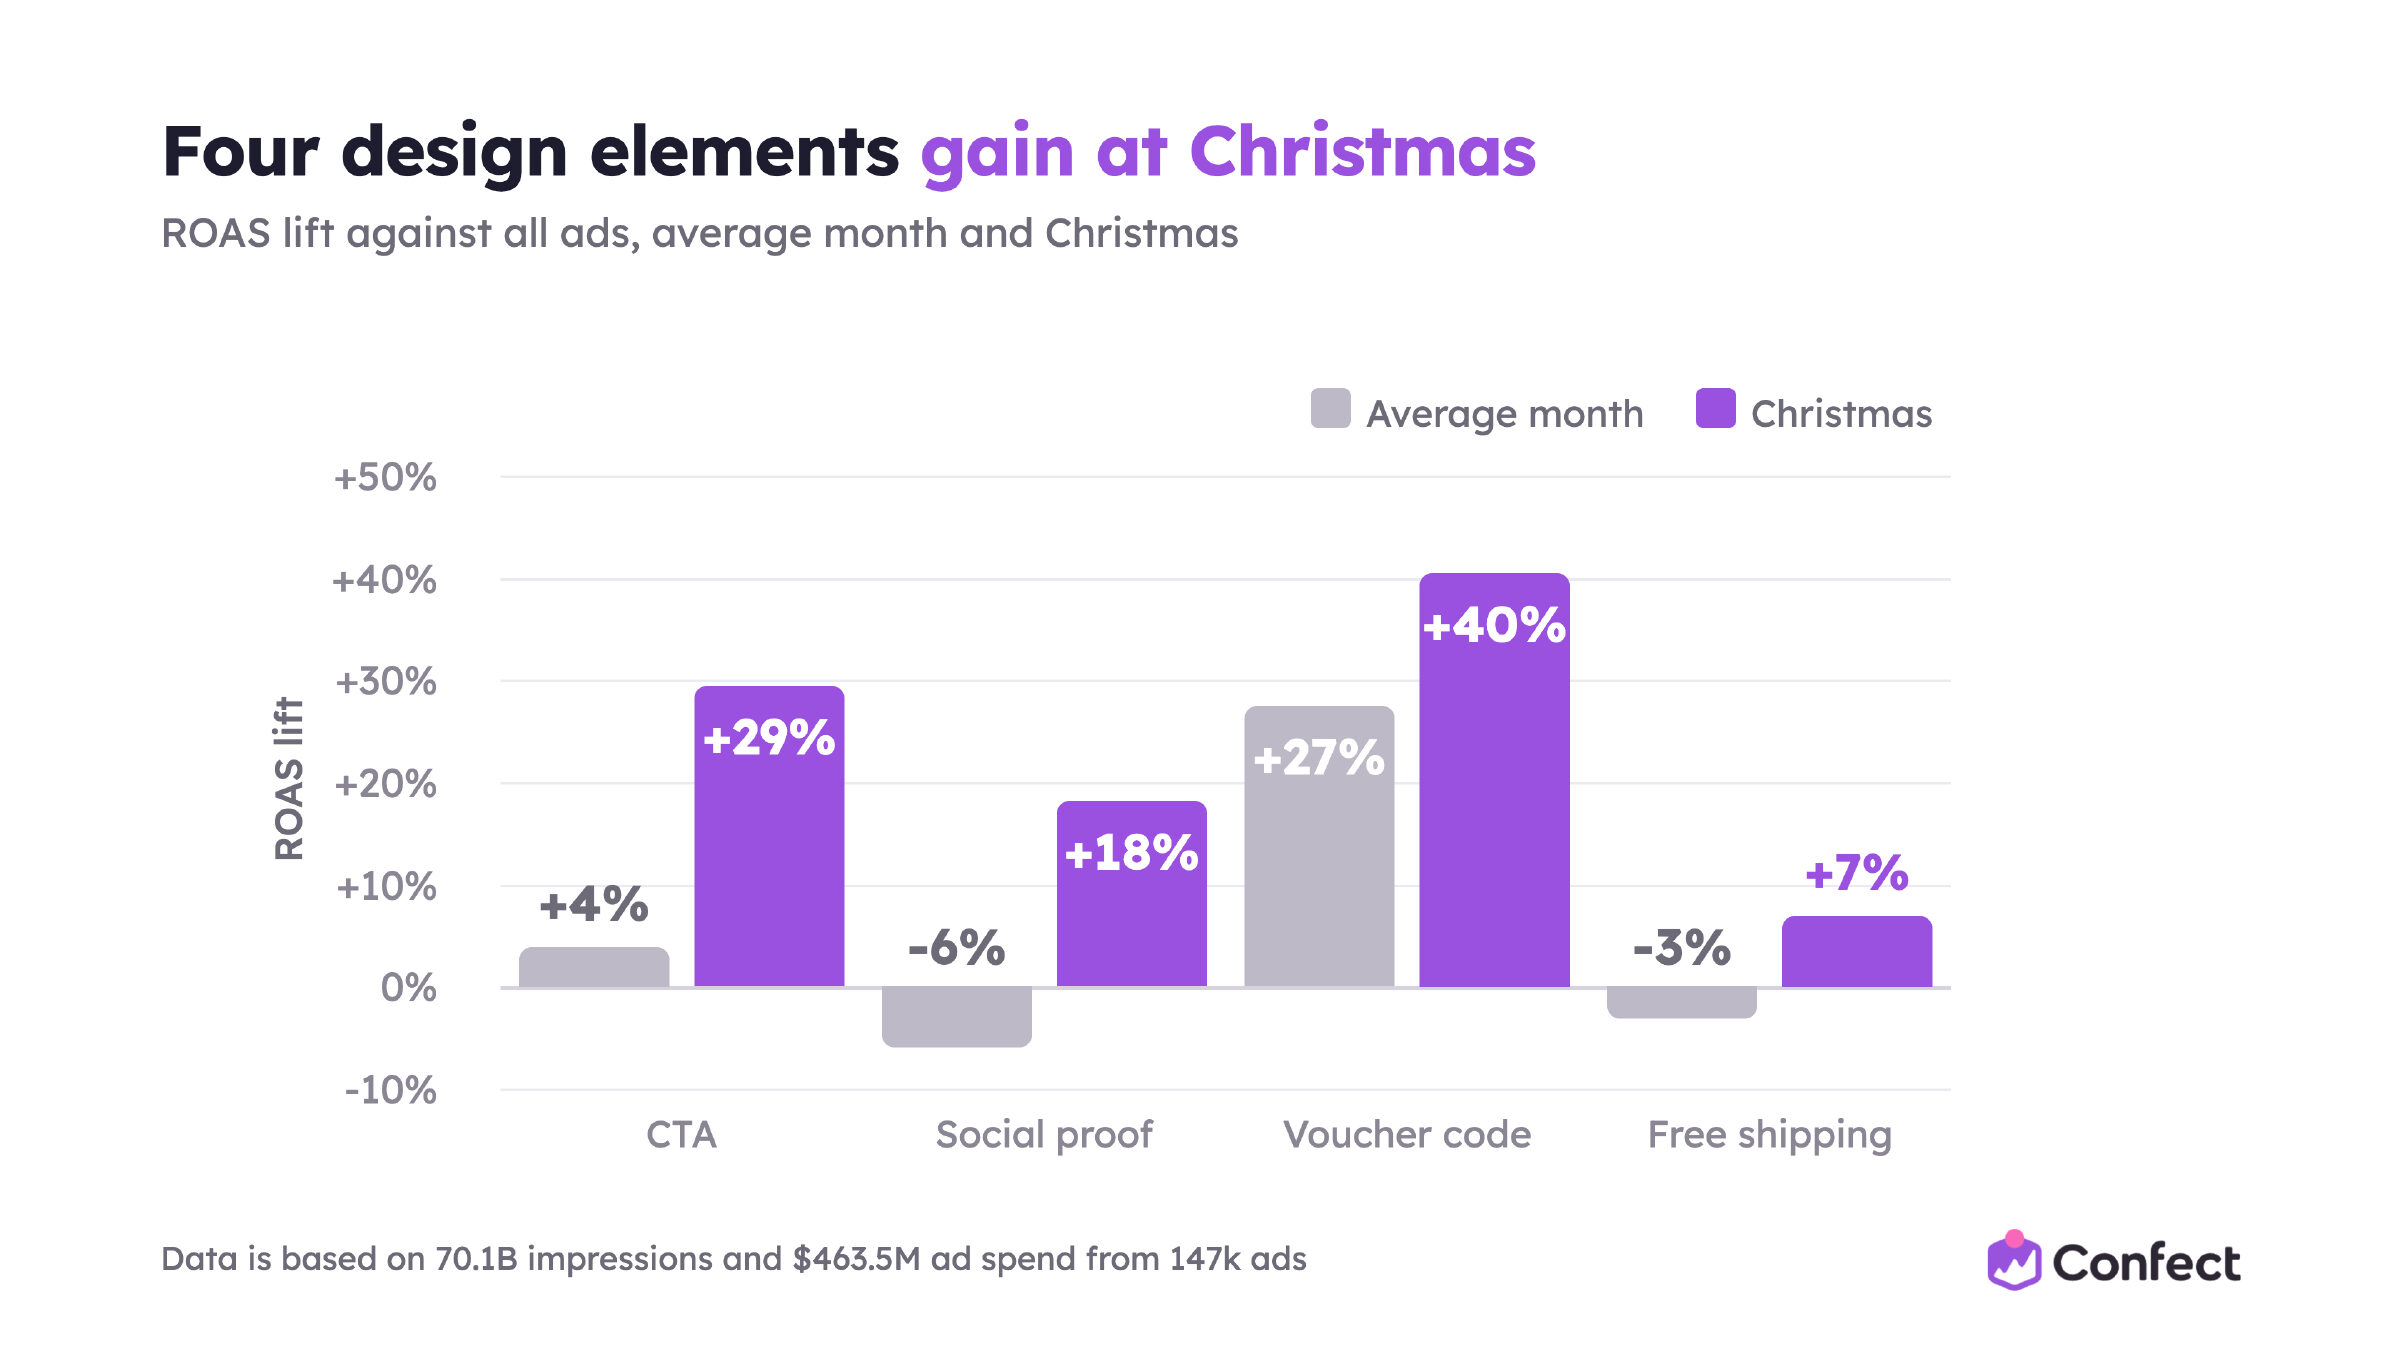
Four elements gain at Christmas
Put the gainers side by side and you get a short list.
- Call to action: from +4% in the average month to +29% at Christmas.
- Social proof: from -6% to +18%.
- Voucher code: from +27% to +40%.
- Free shipping: from -3% to +7%.
Three of them are about removing doubt, and one is about removing hesitation. A clear "Shop gifts" or "Order by 20 December" tells a shopper with a deadline what to do next. Proof that others bought lowers the risk. A code gives a reason to buy here. Free delivery removes the last objection. All four are design choices you make in Confect, not changes to your products or your prices.
Trust matters most for the smallest shops
Here is the finding that ties trust transfer to your budget. We split advertisers by monthly Meta spend: small (under $10k), mid ($10k to $50k) and big (over $50k).
In the average month, trust elements pay most for big advertisers (+13%) and nothing for small ones (-6%). At Christmas it flips. Small advertisers with trust elements return 36% more than their peers, mid-sized 16% more, big ones 7% more.
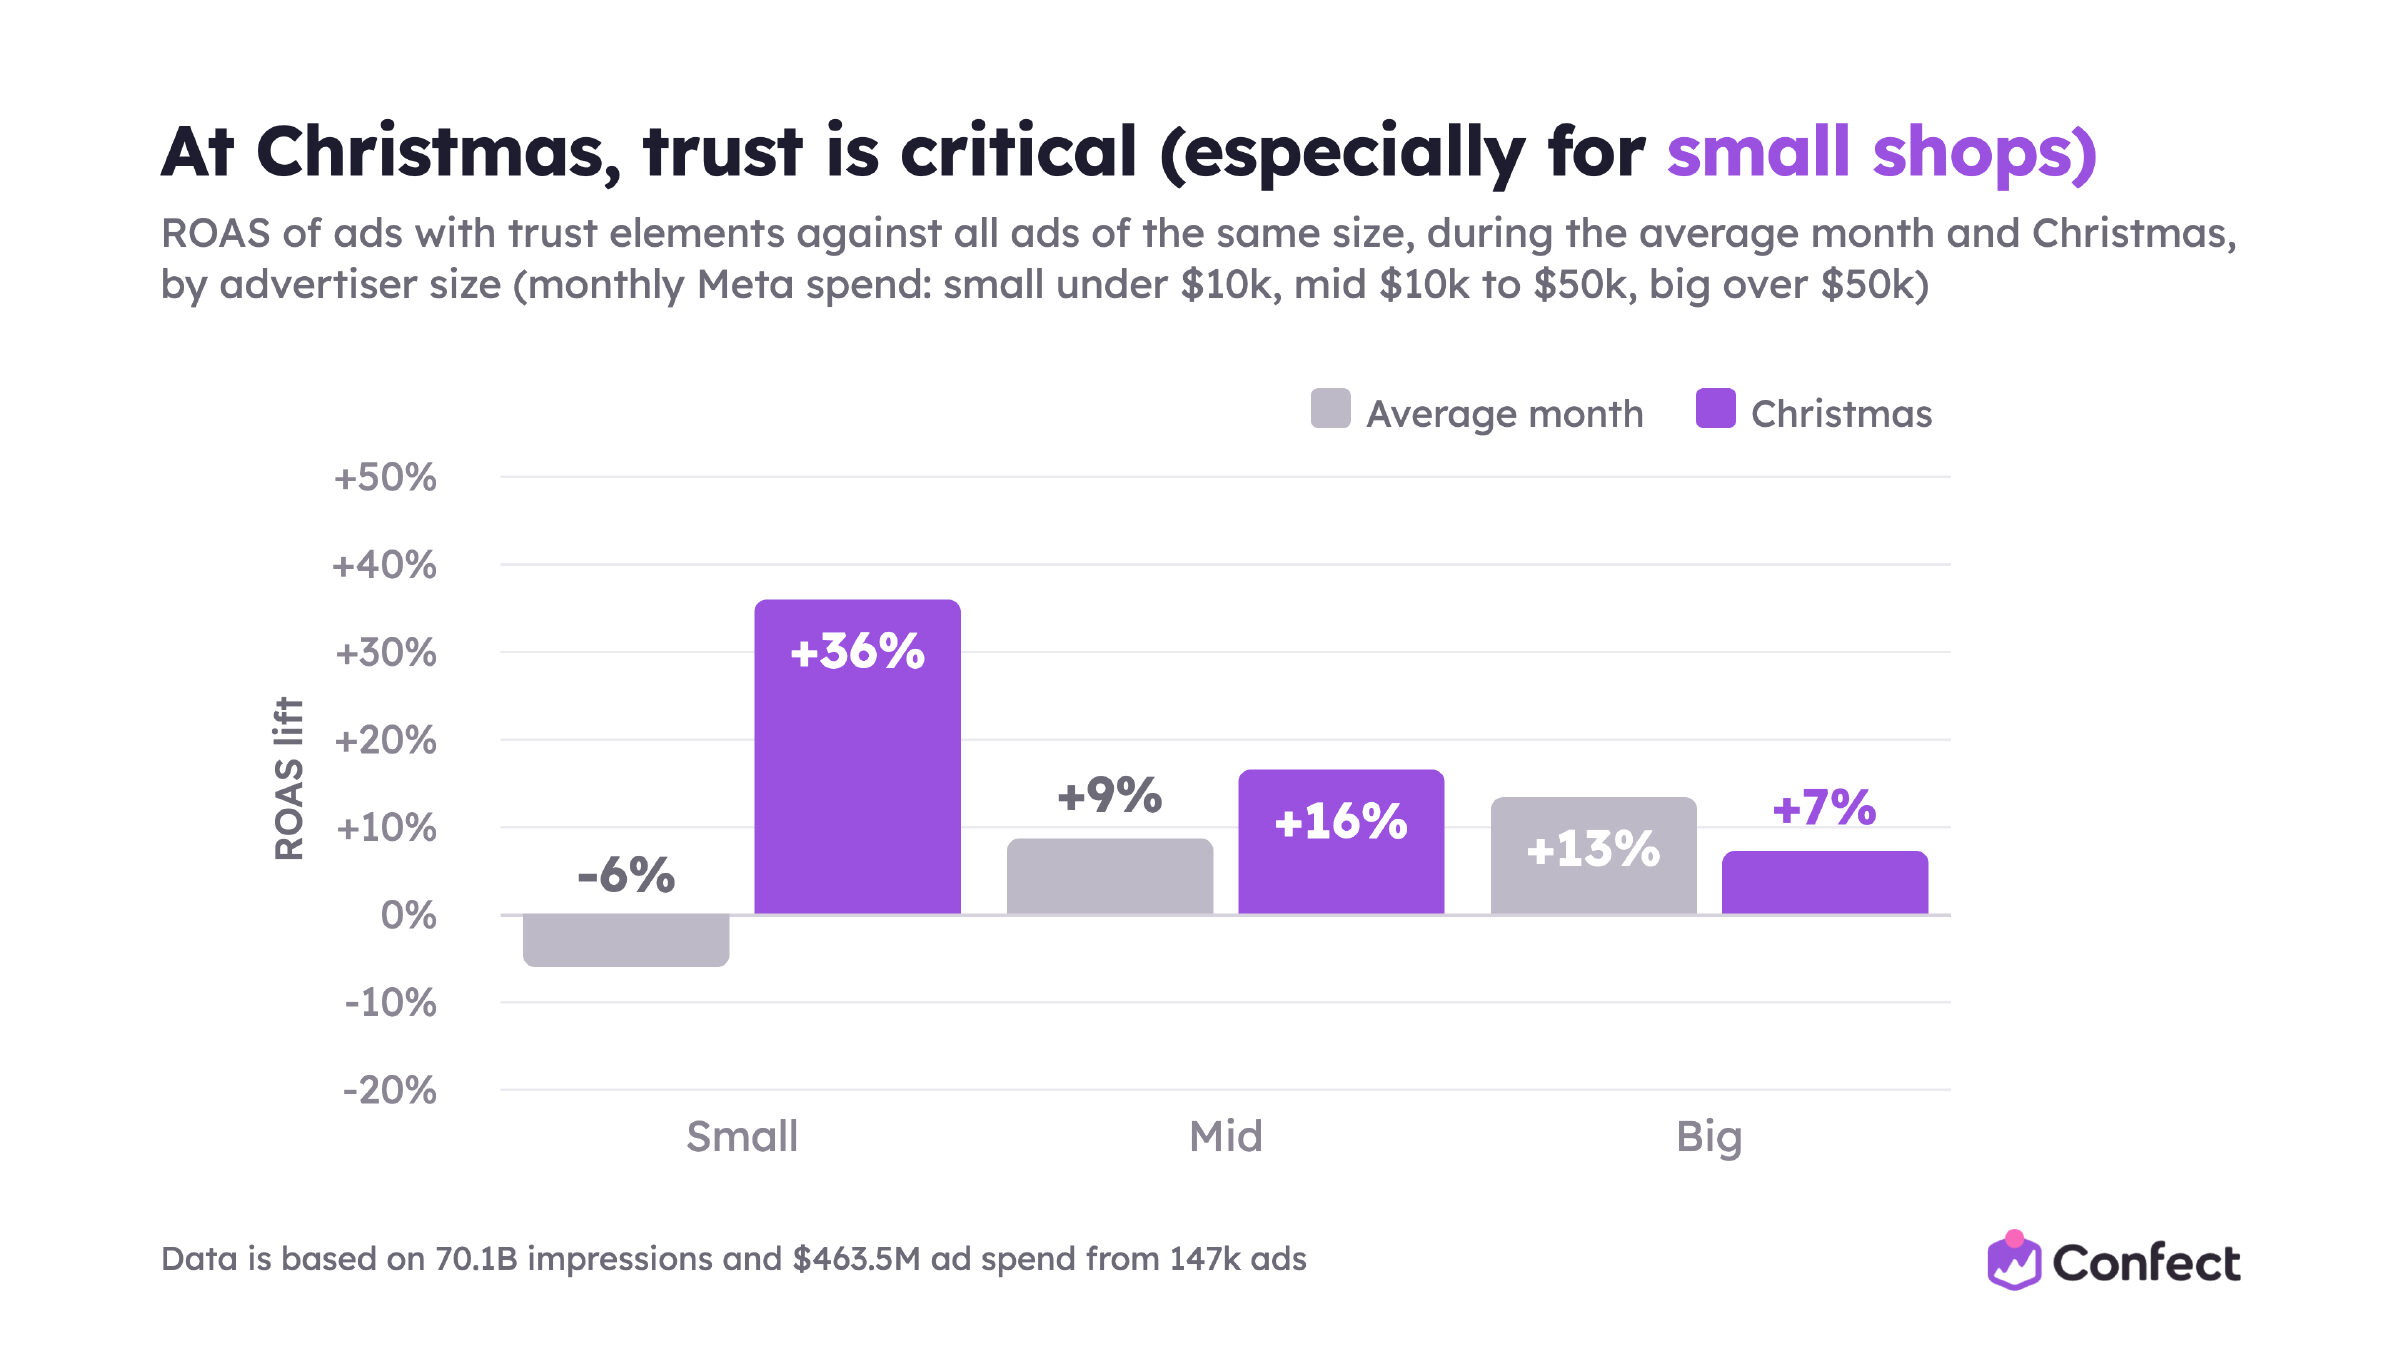
The big names already have the trust. Shoppers have seen them before, and familiarity breeds trust. The small shop has to show it in the ad, and December is when the shopper is actually looking for it. If you are a small shop, this is probably the single most valuable design change in the study.

Trust does not have to be a star rating. Vuori puts “Our best-selling holiday gifts” next to every product, under a “Holiday Gift Guide” headline. That is social proof in its softest form: other people bought this, and someone has already done the choosing for you.
For a small shop, the move is the same with harder evidence: a review count, a rating, a quality guarantee. December is the one month the shopper goes looking for it, and the small shop is the one that has to show it.
Brands and retailers win with different elements
Remember the trust transfer point from the shop type section. It shows up again here.
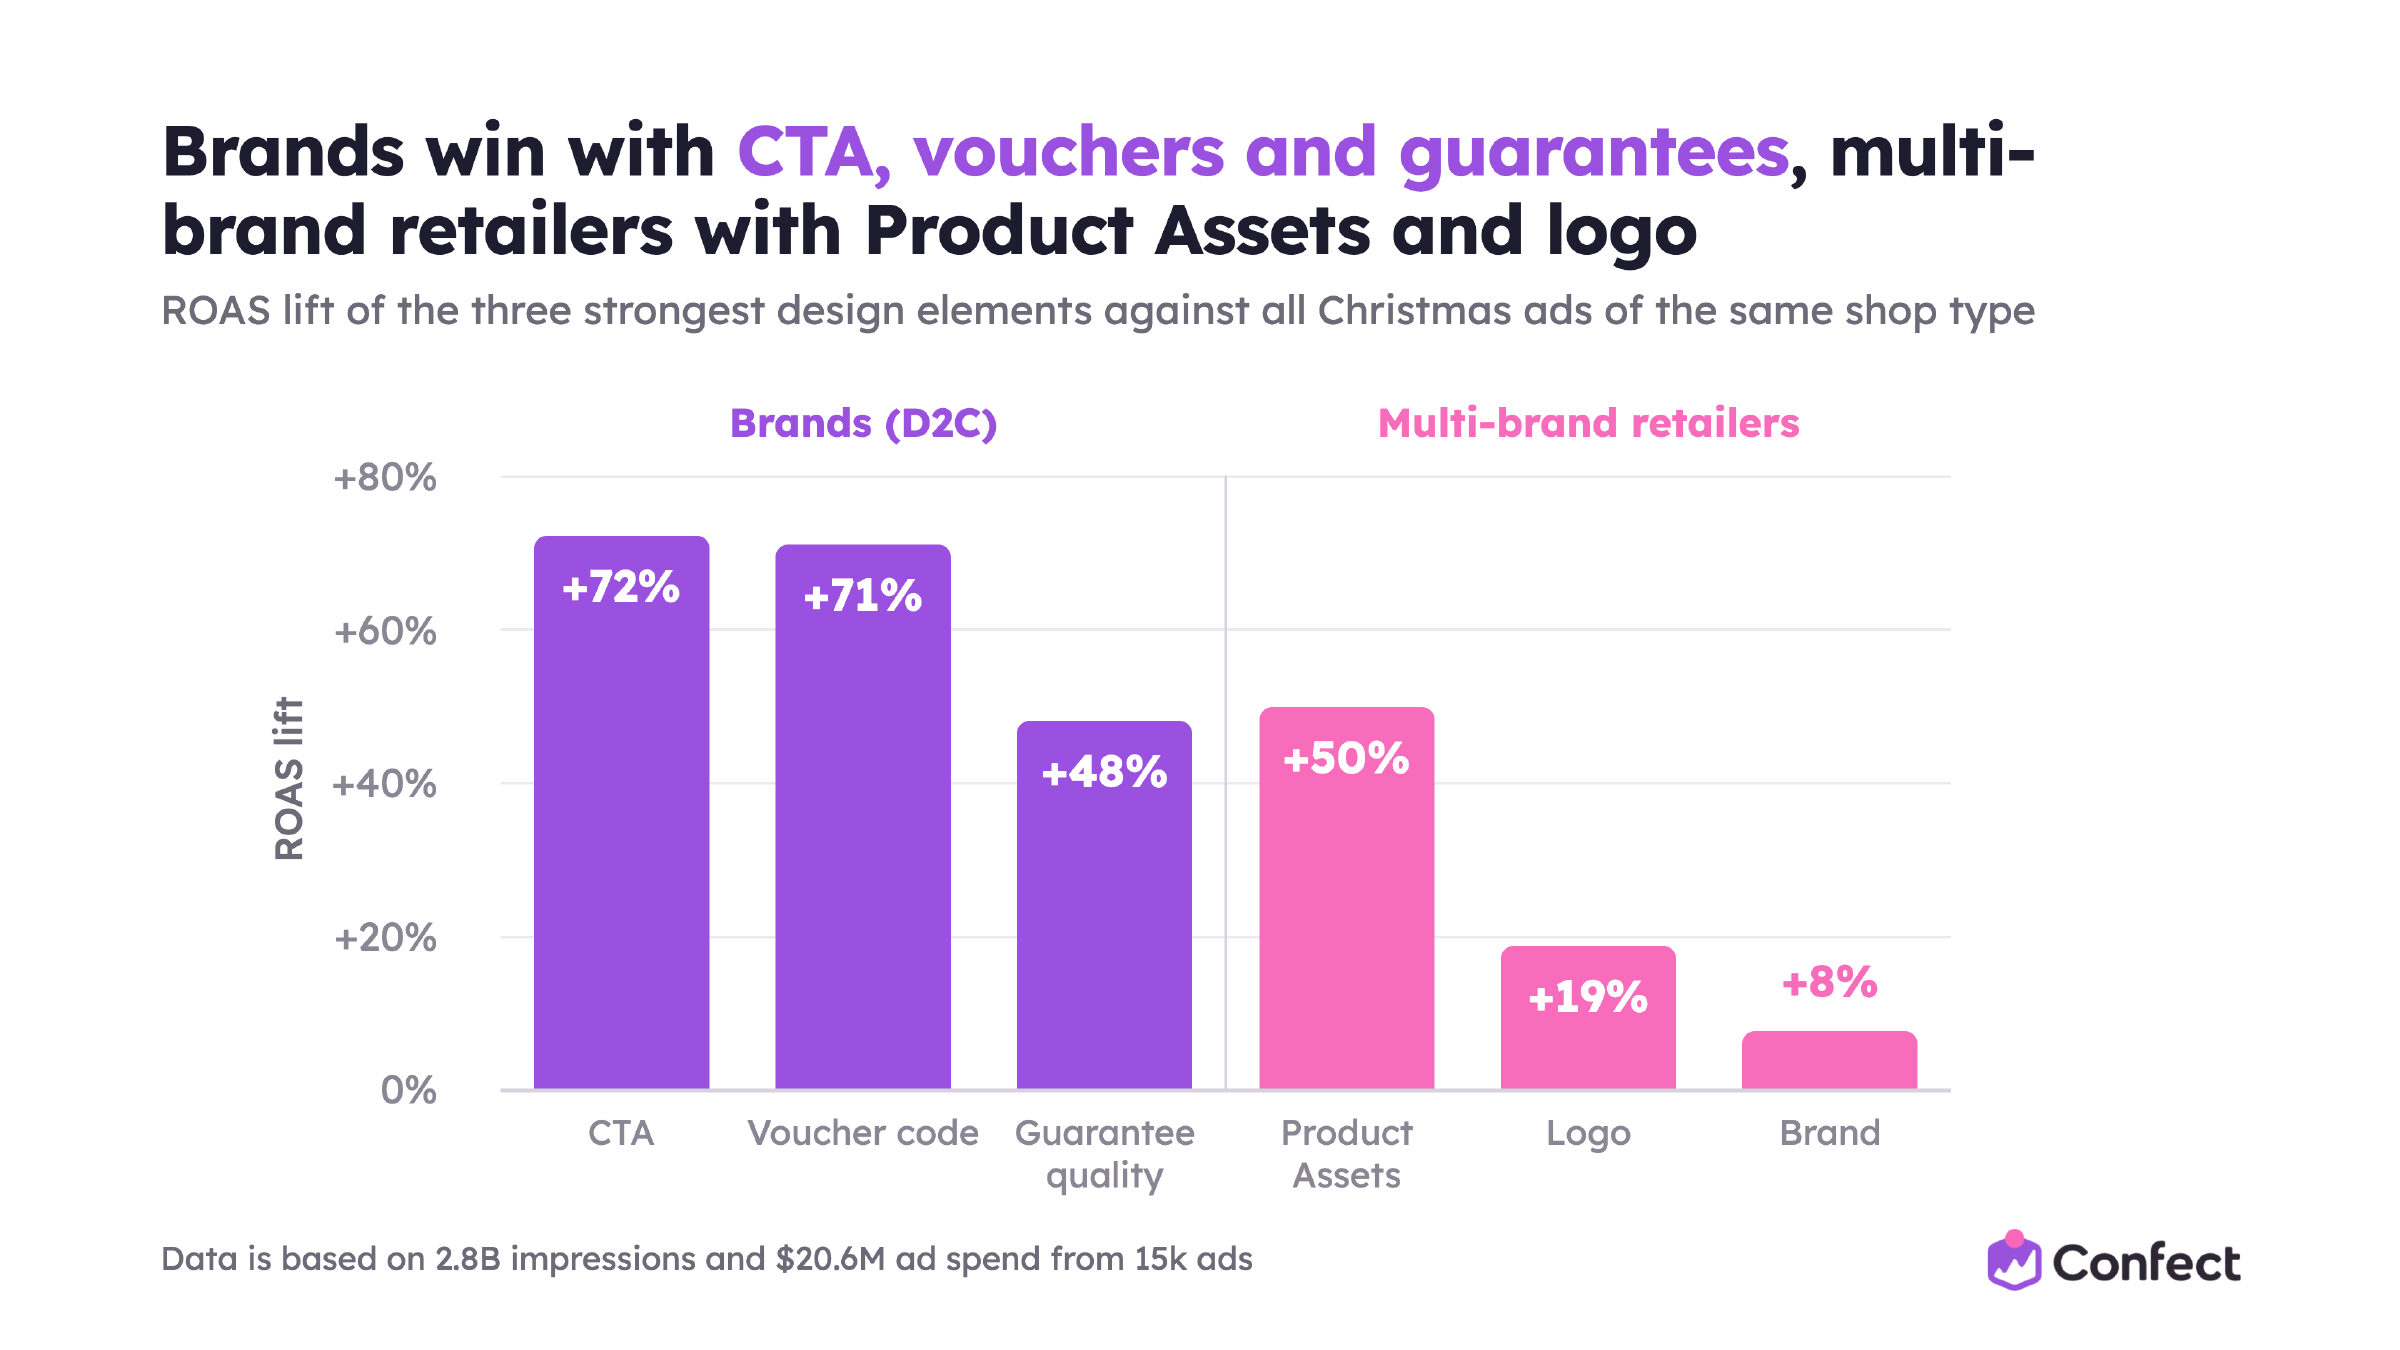
For D2C brands, the three strongest Christmas elements are the call to action (+72%), the voucher code (+71%) and a quality guarantee (+48%).
The brand already has the trust, so the design can spend its space on getting the shopper to act.
For multi-brand retailers, the top three are Product Assets (+50%), the logo (+19%) and the brand name (+8%). The retailer is selling someone else's product, and the shopper is comparing tabs. The retailer's job is to look like a place worth buying it from, and that is what a logo and a consistent Product Asset do.
You can see the retailer version in HiFi Klubben’s Catalog Ad of the Week. The home audio chain shows the logo of each product’s own brand, adds a three-year guarantee and a star rating, and saw ROAS rise 48%. The famous brand answers “is this a good product”. The retailer’s guarantee answers “is this a good place to buy it”.
Shipping info pays in retargeting
Across all Christmas ads, shipping information is flat. Split by funnel and it comes alive. In retargeting, Christmas ads with shipping info return 13% more than the typical retargeting ad (ROAS 6.67 against 5.88). In prospecting there is no difference.
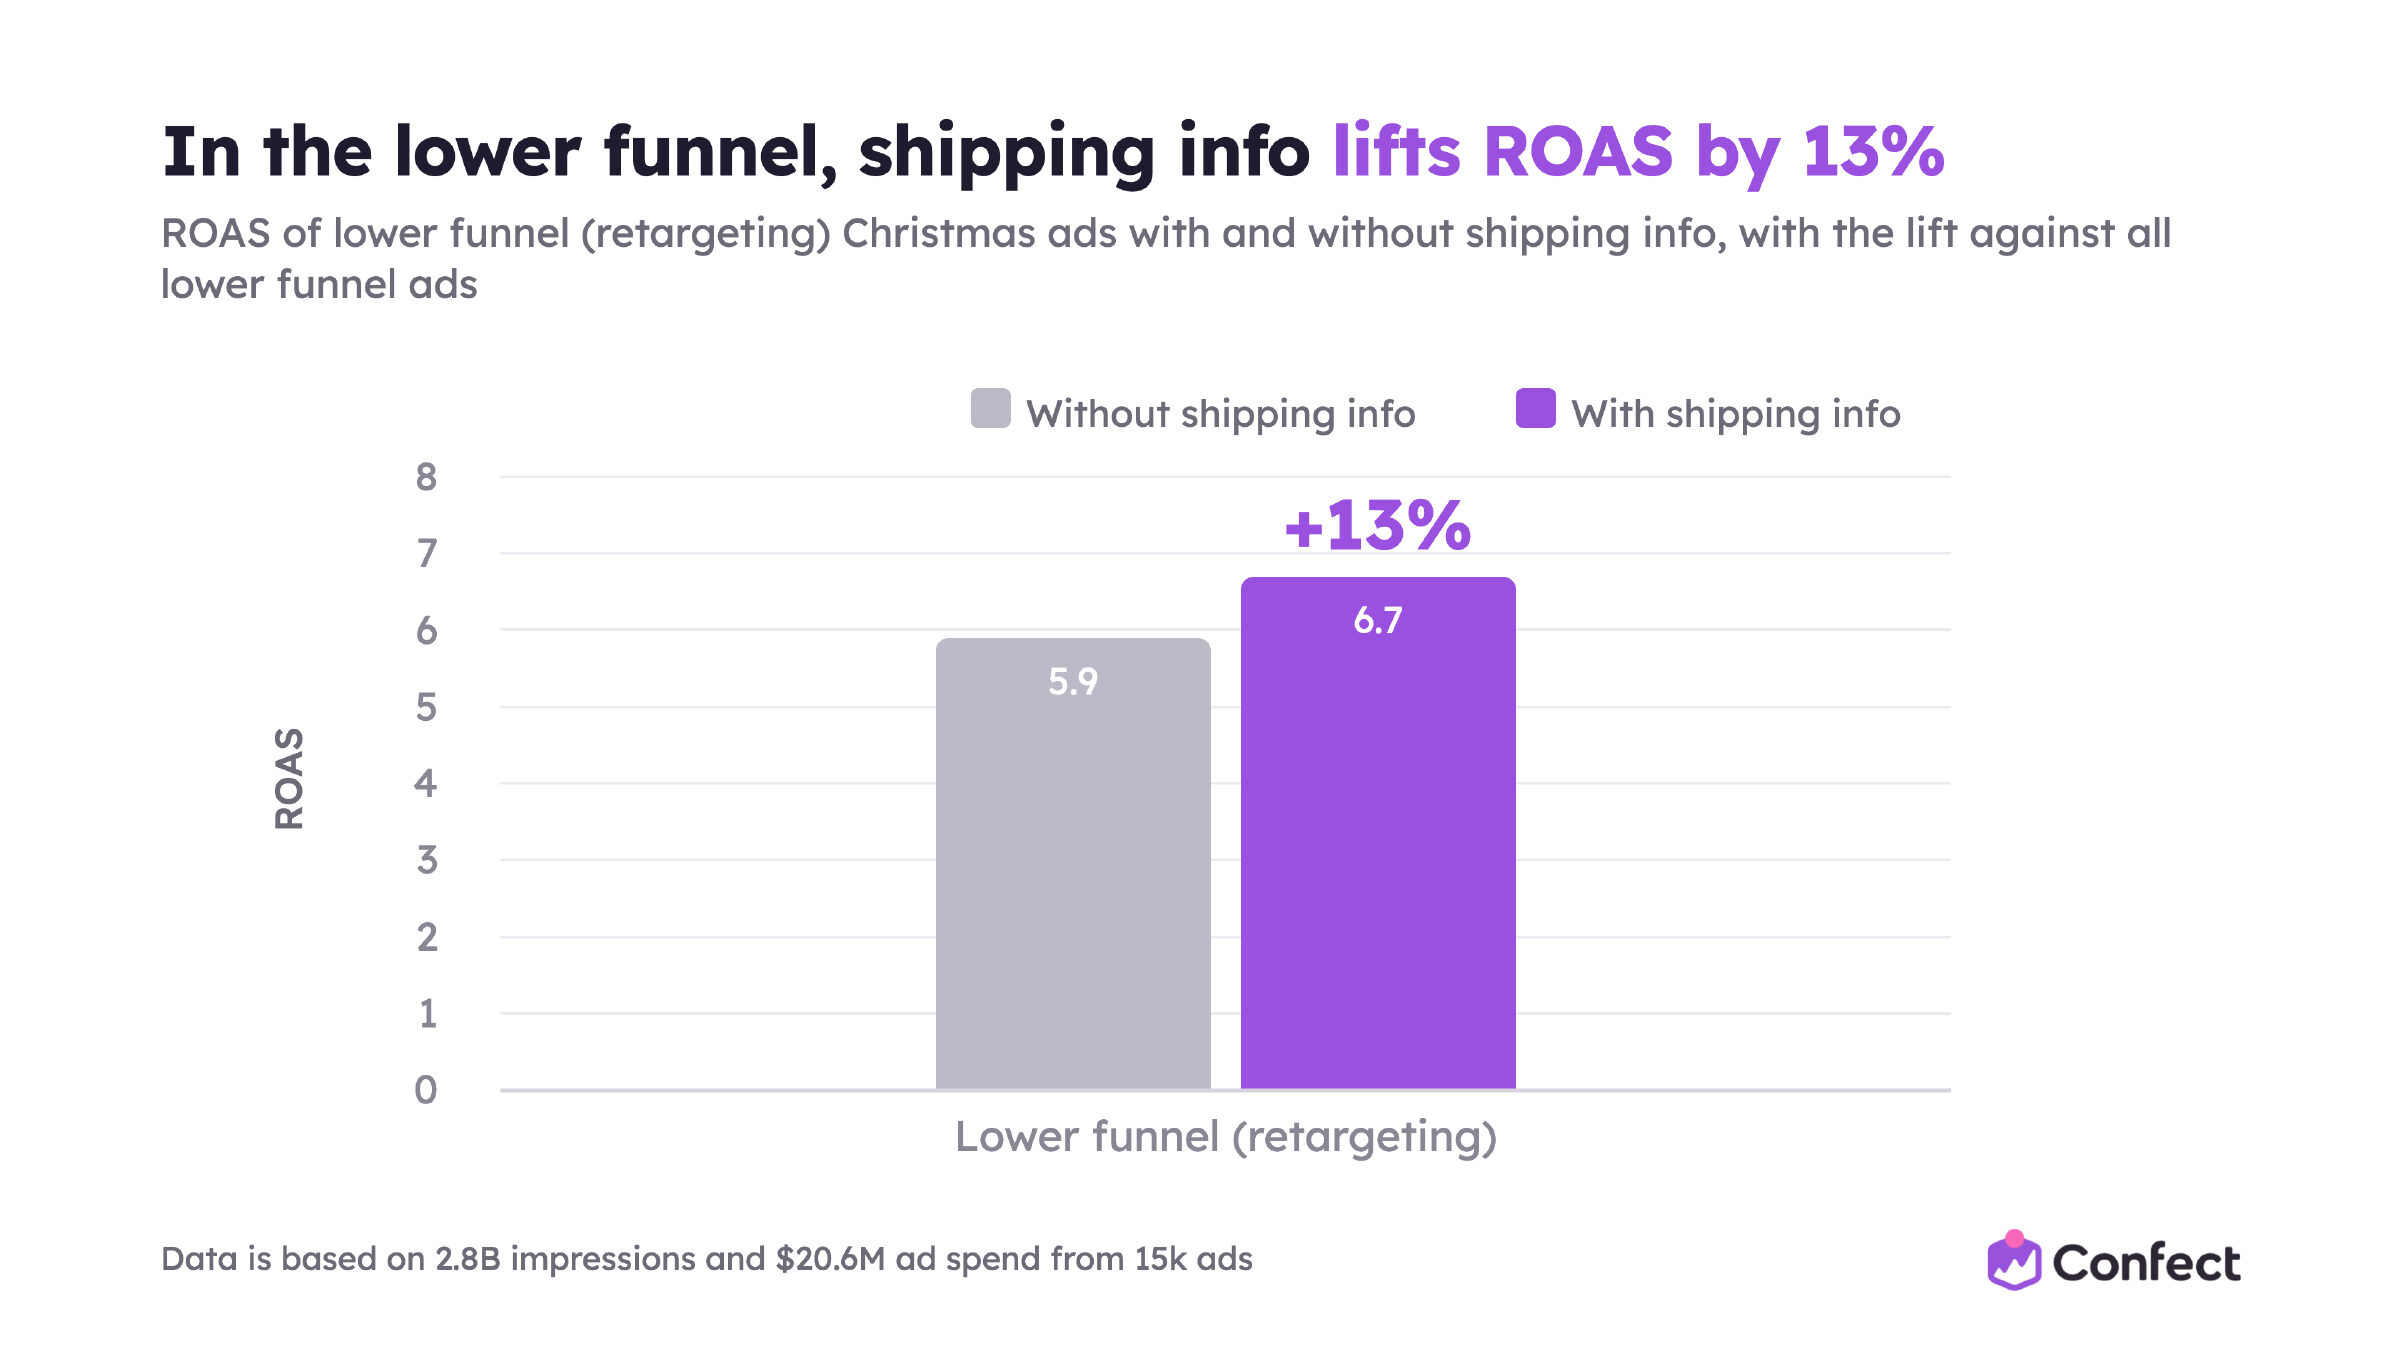
That makes sense once you picture the shopper. Someone seeing your product for the first time does not care about delivery yet. Someone who has visited your site, added to cart and left is asking one question: will it arrive before the 24th? Answer it in the ad. Free shipping (+25%), shipping terms (+18%) and delivery speed (+13%) all keep their lead in retargeting at Christmas.
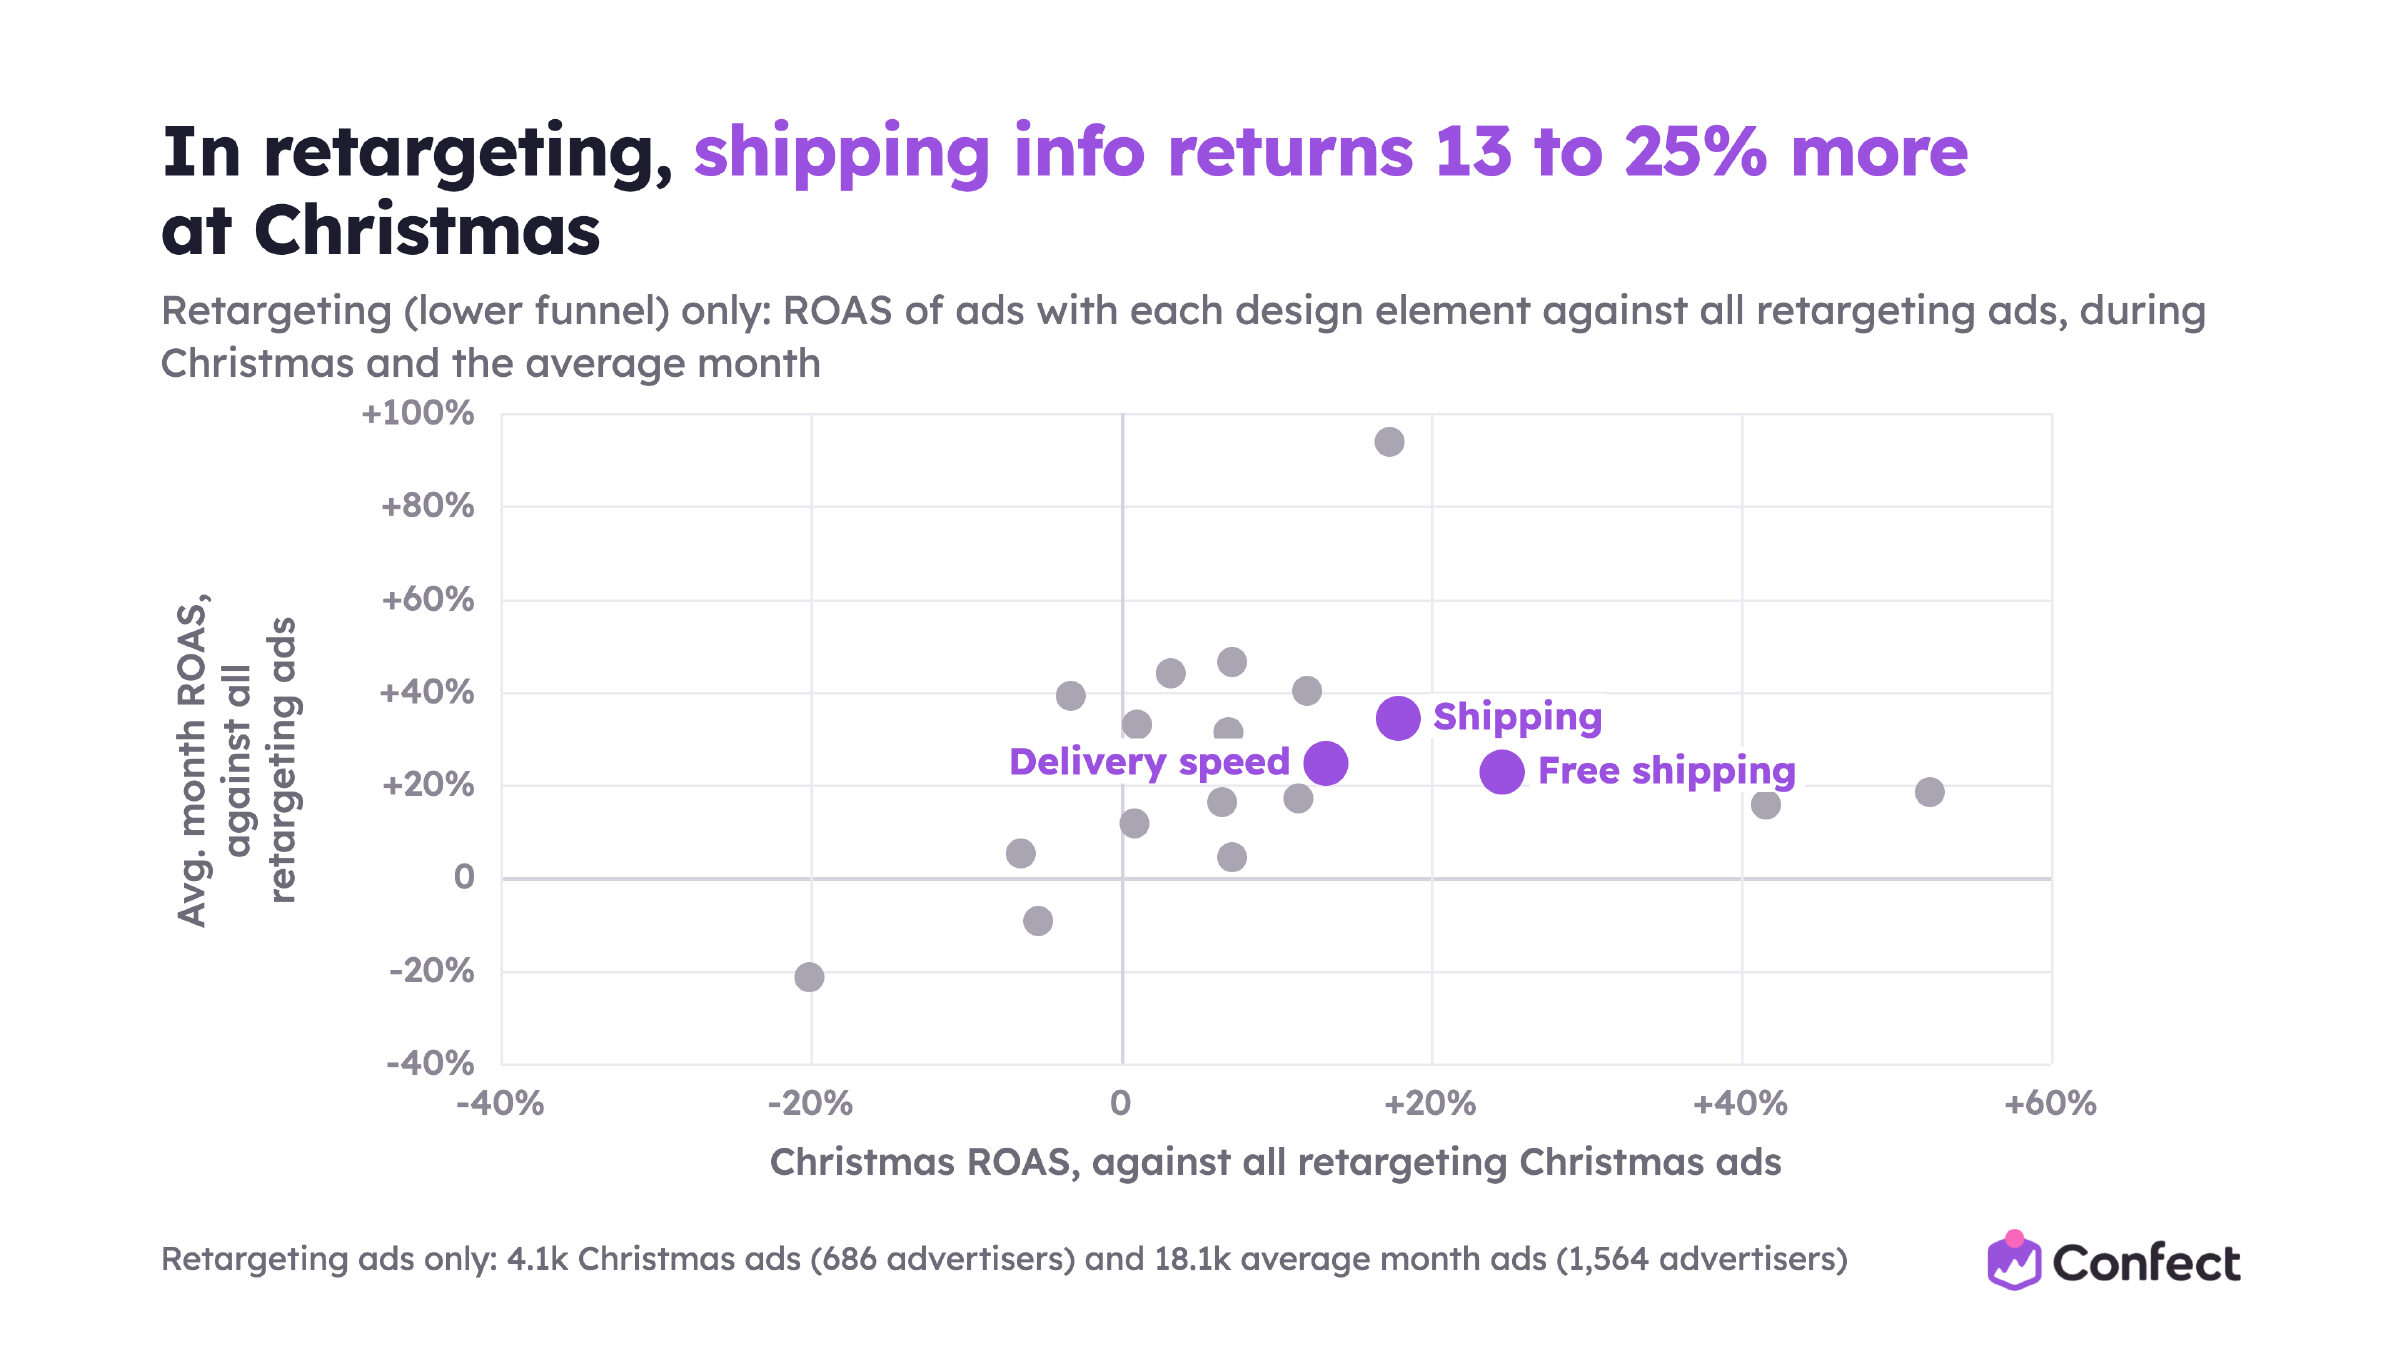
This is friction removal in its purest form: find the concern and answer it in the creative. Among the bigger advertisers, shipping info goes with a 37% lift at Christmas, which fits: big shops have the logistics to promise a delivery date, and shoppers believe them.
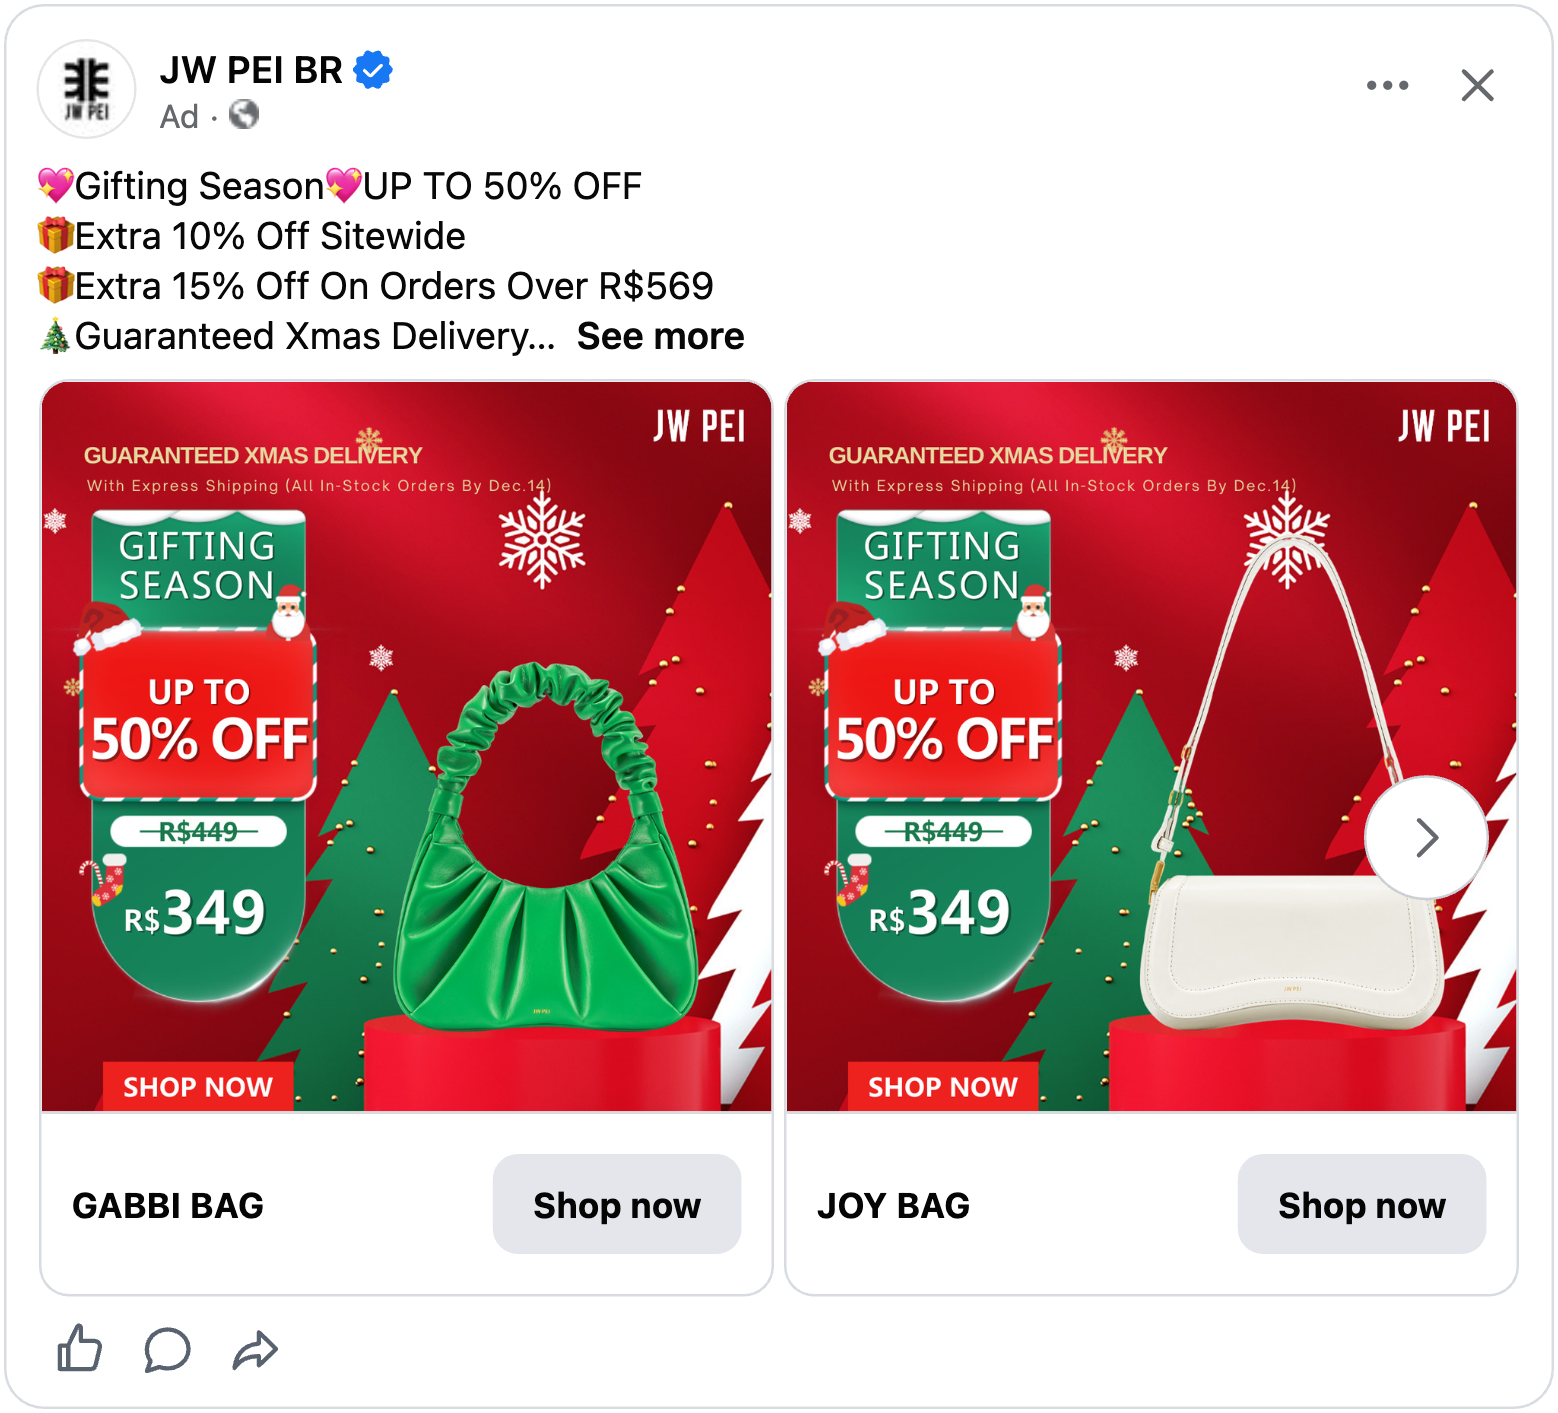
JW PEI puts the answer at the very top of the design: “Guaranteed Xmas delivery, with express shipping, all in-stock orders by Dec. 14”. It sits above the discount, above the price and above the bag. For a shopper who left that bag in their cart last week, it is the line that matters.
A delivery date also works as a call to action. “Order by 14 December” is a deadline the shopper believes, because it comes from the calendar, not from your sale.
Product Assets work all year, Christmas included
Ads with Product Assets return 29% more than the typical Christmas ad. In the average month, 31% more. It is the most robust design finding in the whole study, and the only one that also holds when we compare ads within the same advertiser.
A Product Asset is a logo, a badge or a label attached to the product itself, chosen by a product field: a brand logo on each brand's products, a gift badge on products tagged as gifts. It does two jobs at once. It makes the ad look designed, which lifts click-through, and it carries a small trust signal on every single product without you touching the design.
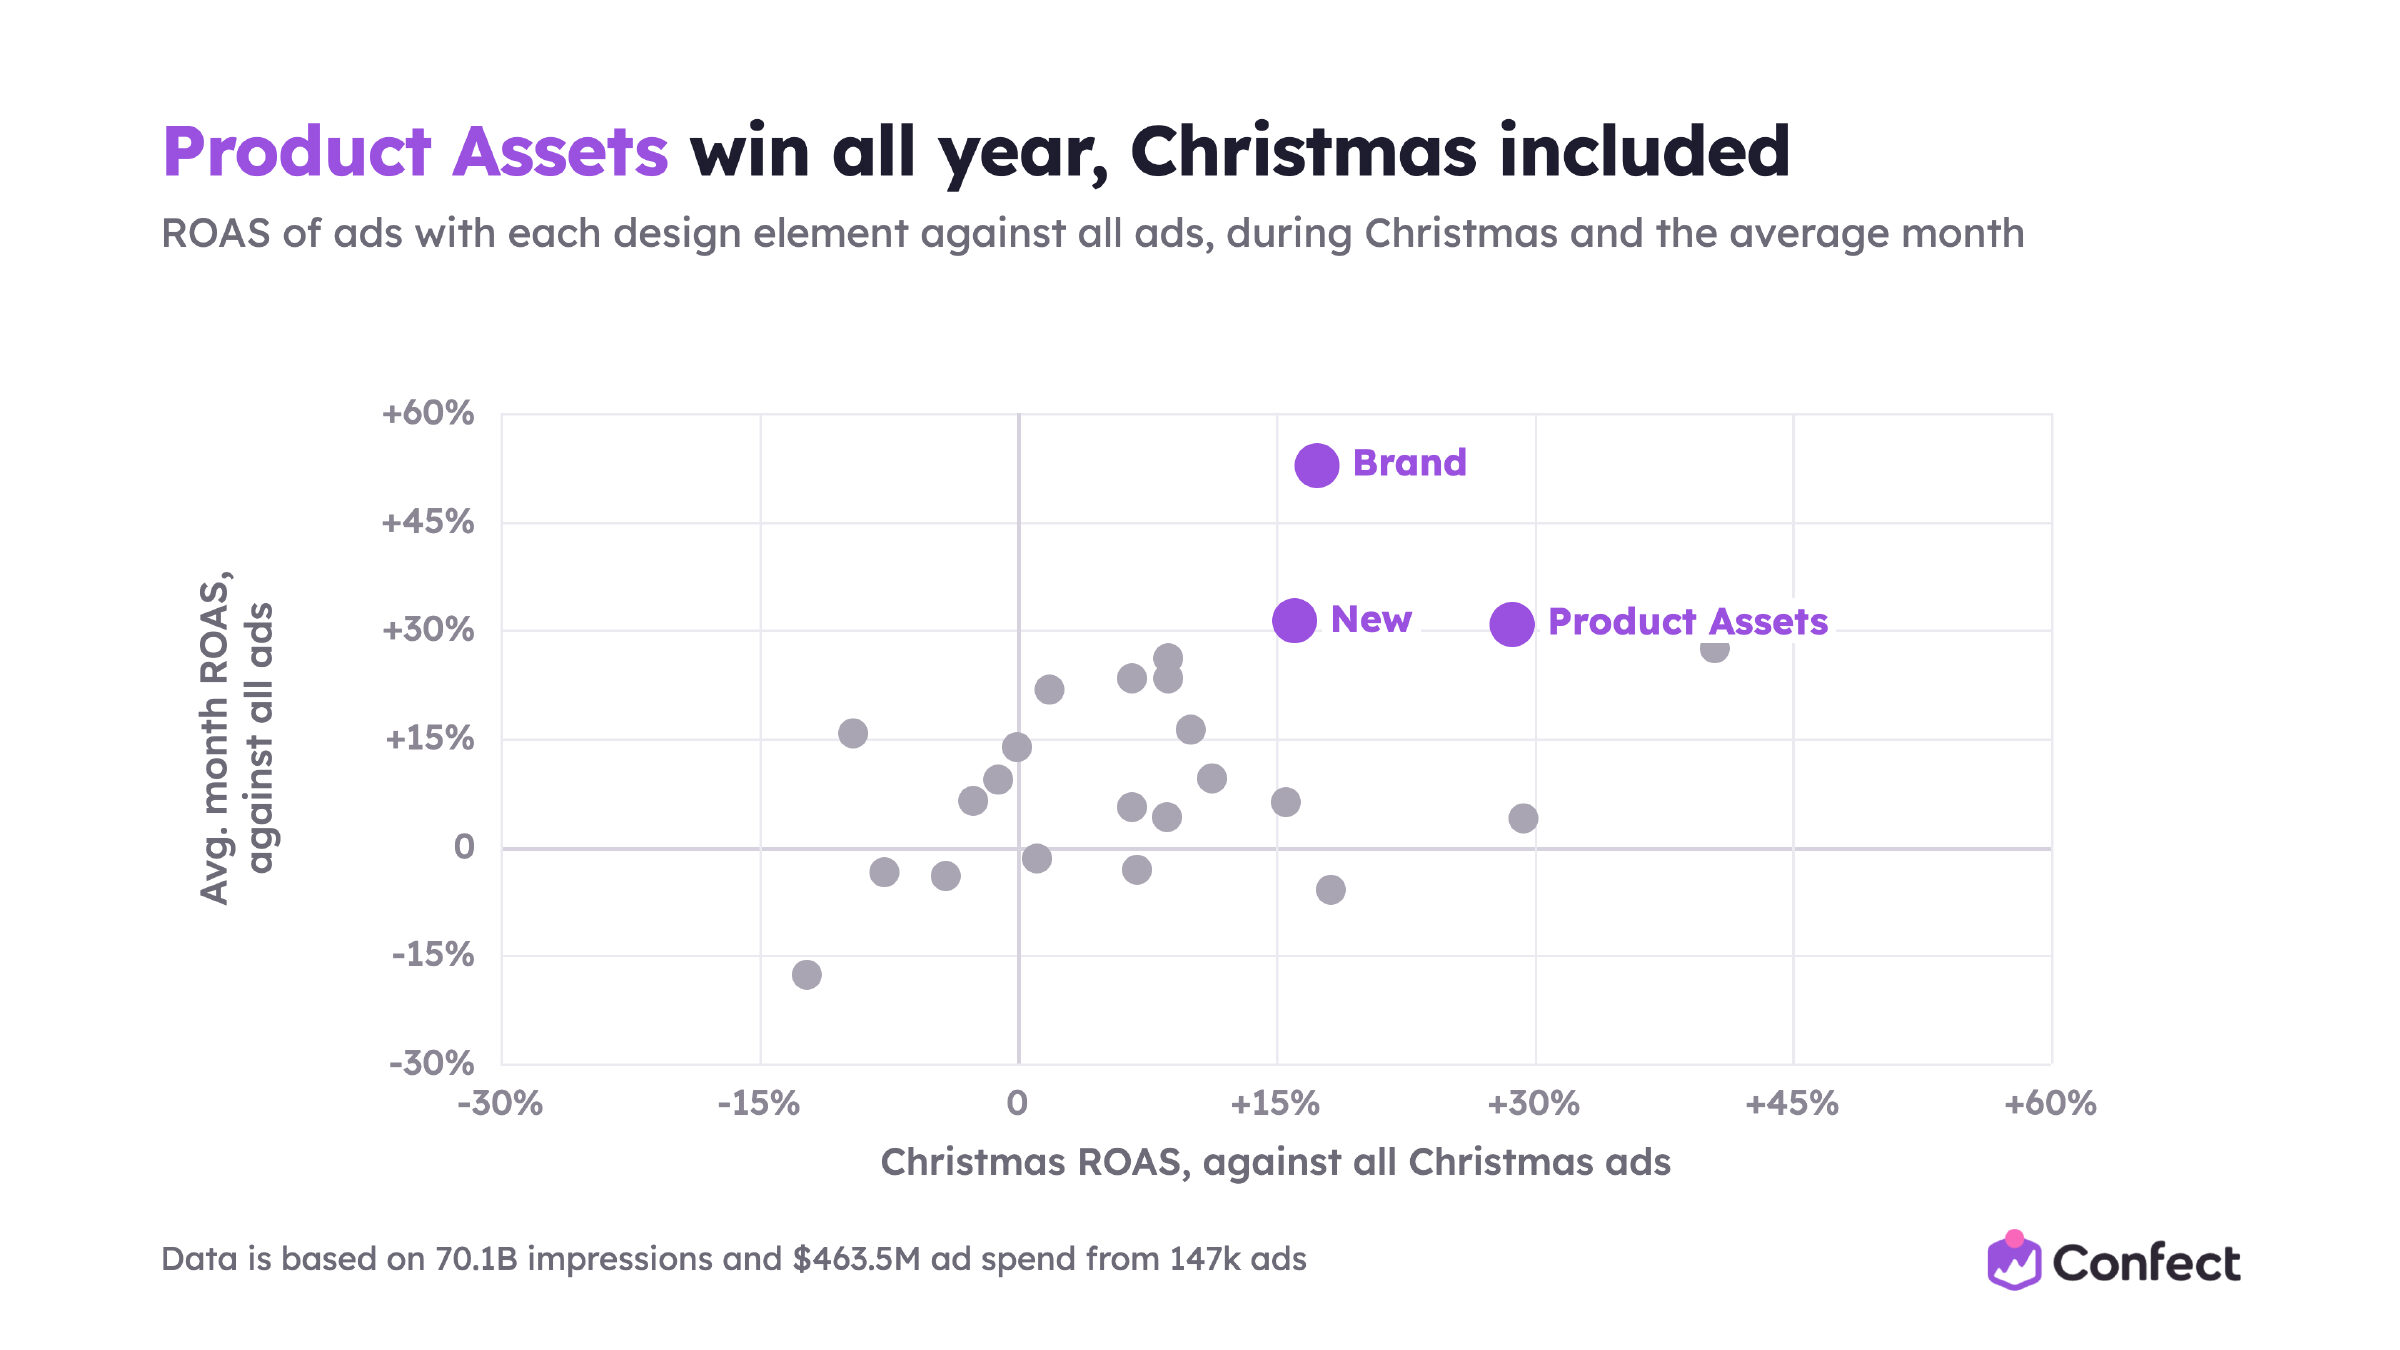
At Christmas, a gift badge on the products you want to sell as gifts is the obvious use.
Setting it up takes one product field and one decision. Tag your gift-friendly products in the data source, for example in a custom label, and let the badge follow the tag. Every product that qualifies gets a “Gift idea” badge, every product that does not stays clean, and nobody has to touch a design when the catalog changes.
New products still return 16% more
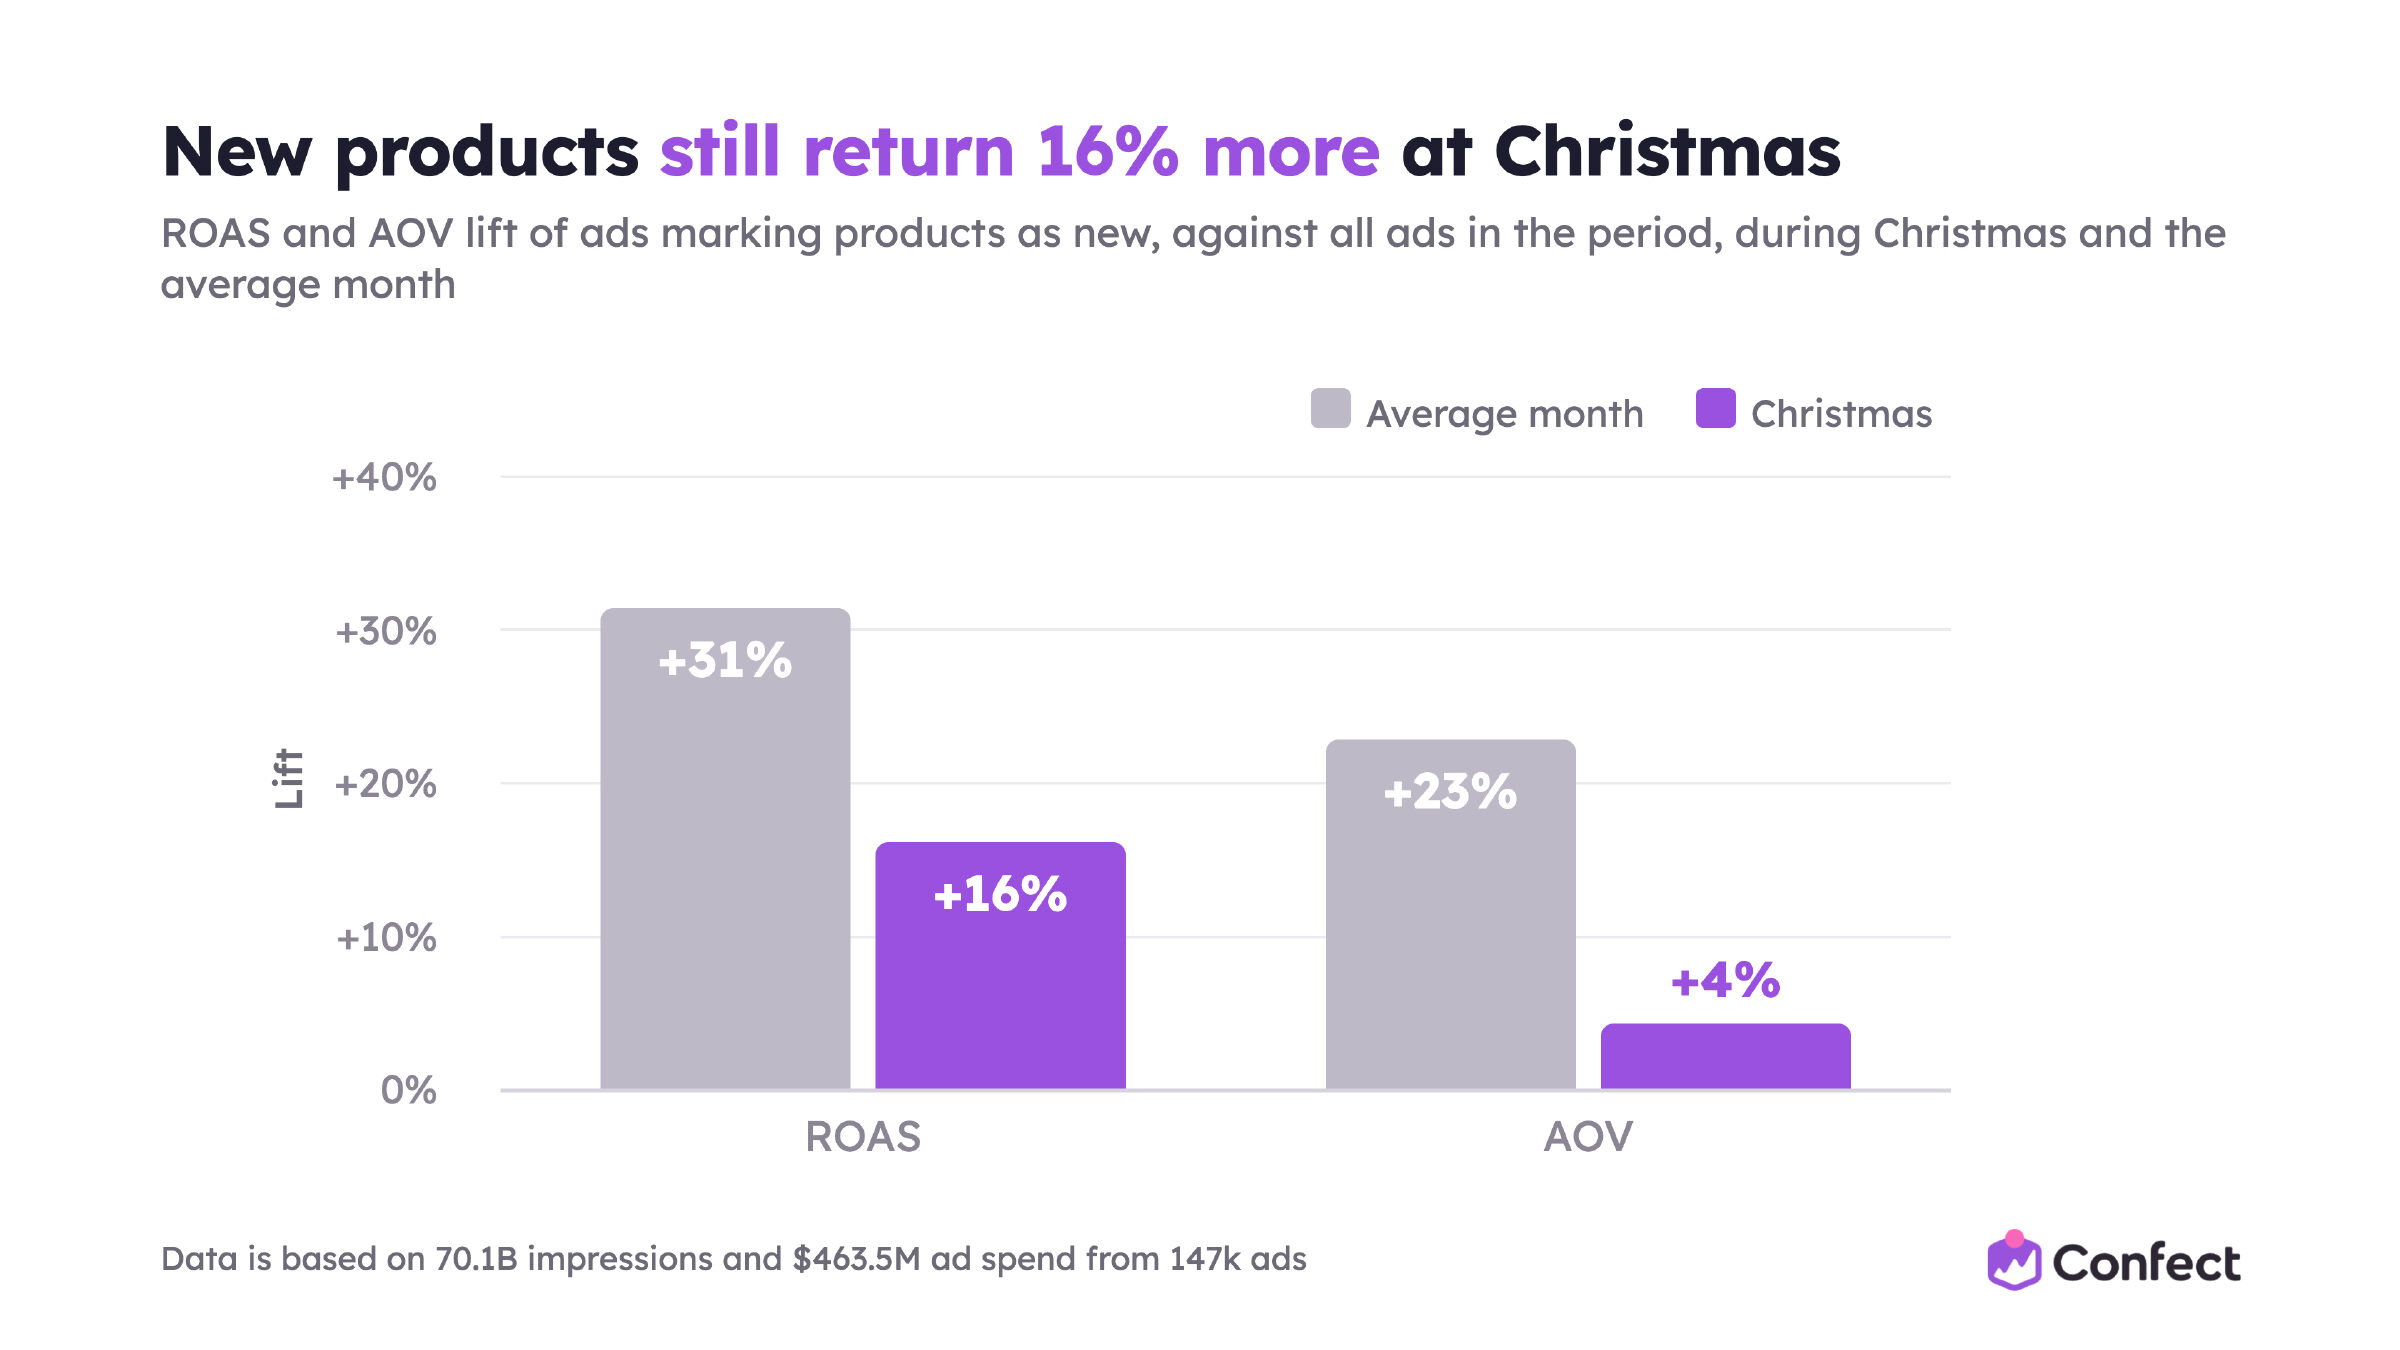
Ads marking products as new return 31% more than the typical ad in the average month and 16% more at Christmas. Still good. Just less.
Most of the drop is basket size. Outside Christmas, new products sell at a higher order value (+23%). At Christmas, the gift budget evens that out (+4%). New releases keep their news value, but the weeks before Christmas are the worst time to launch: competition, attention and CPM are all at their peak. If you can, launch in October and sell it as a gift in December.
The more designs you test, the more you earn
We showed this chart in the setup section and we are showing it again, because it is the biggest creative point in the study.
Ads with six designs in the variant return 45% more than the typical Christmas ad. Ads with none return 12% less. Every step in between helps.
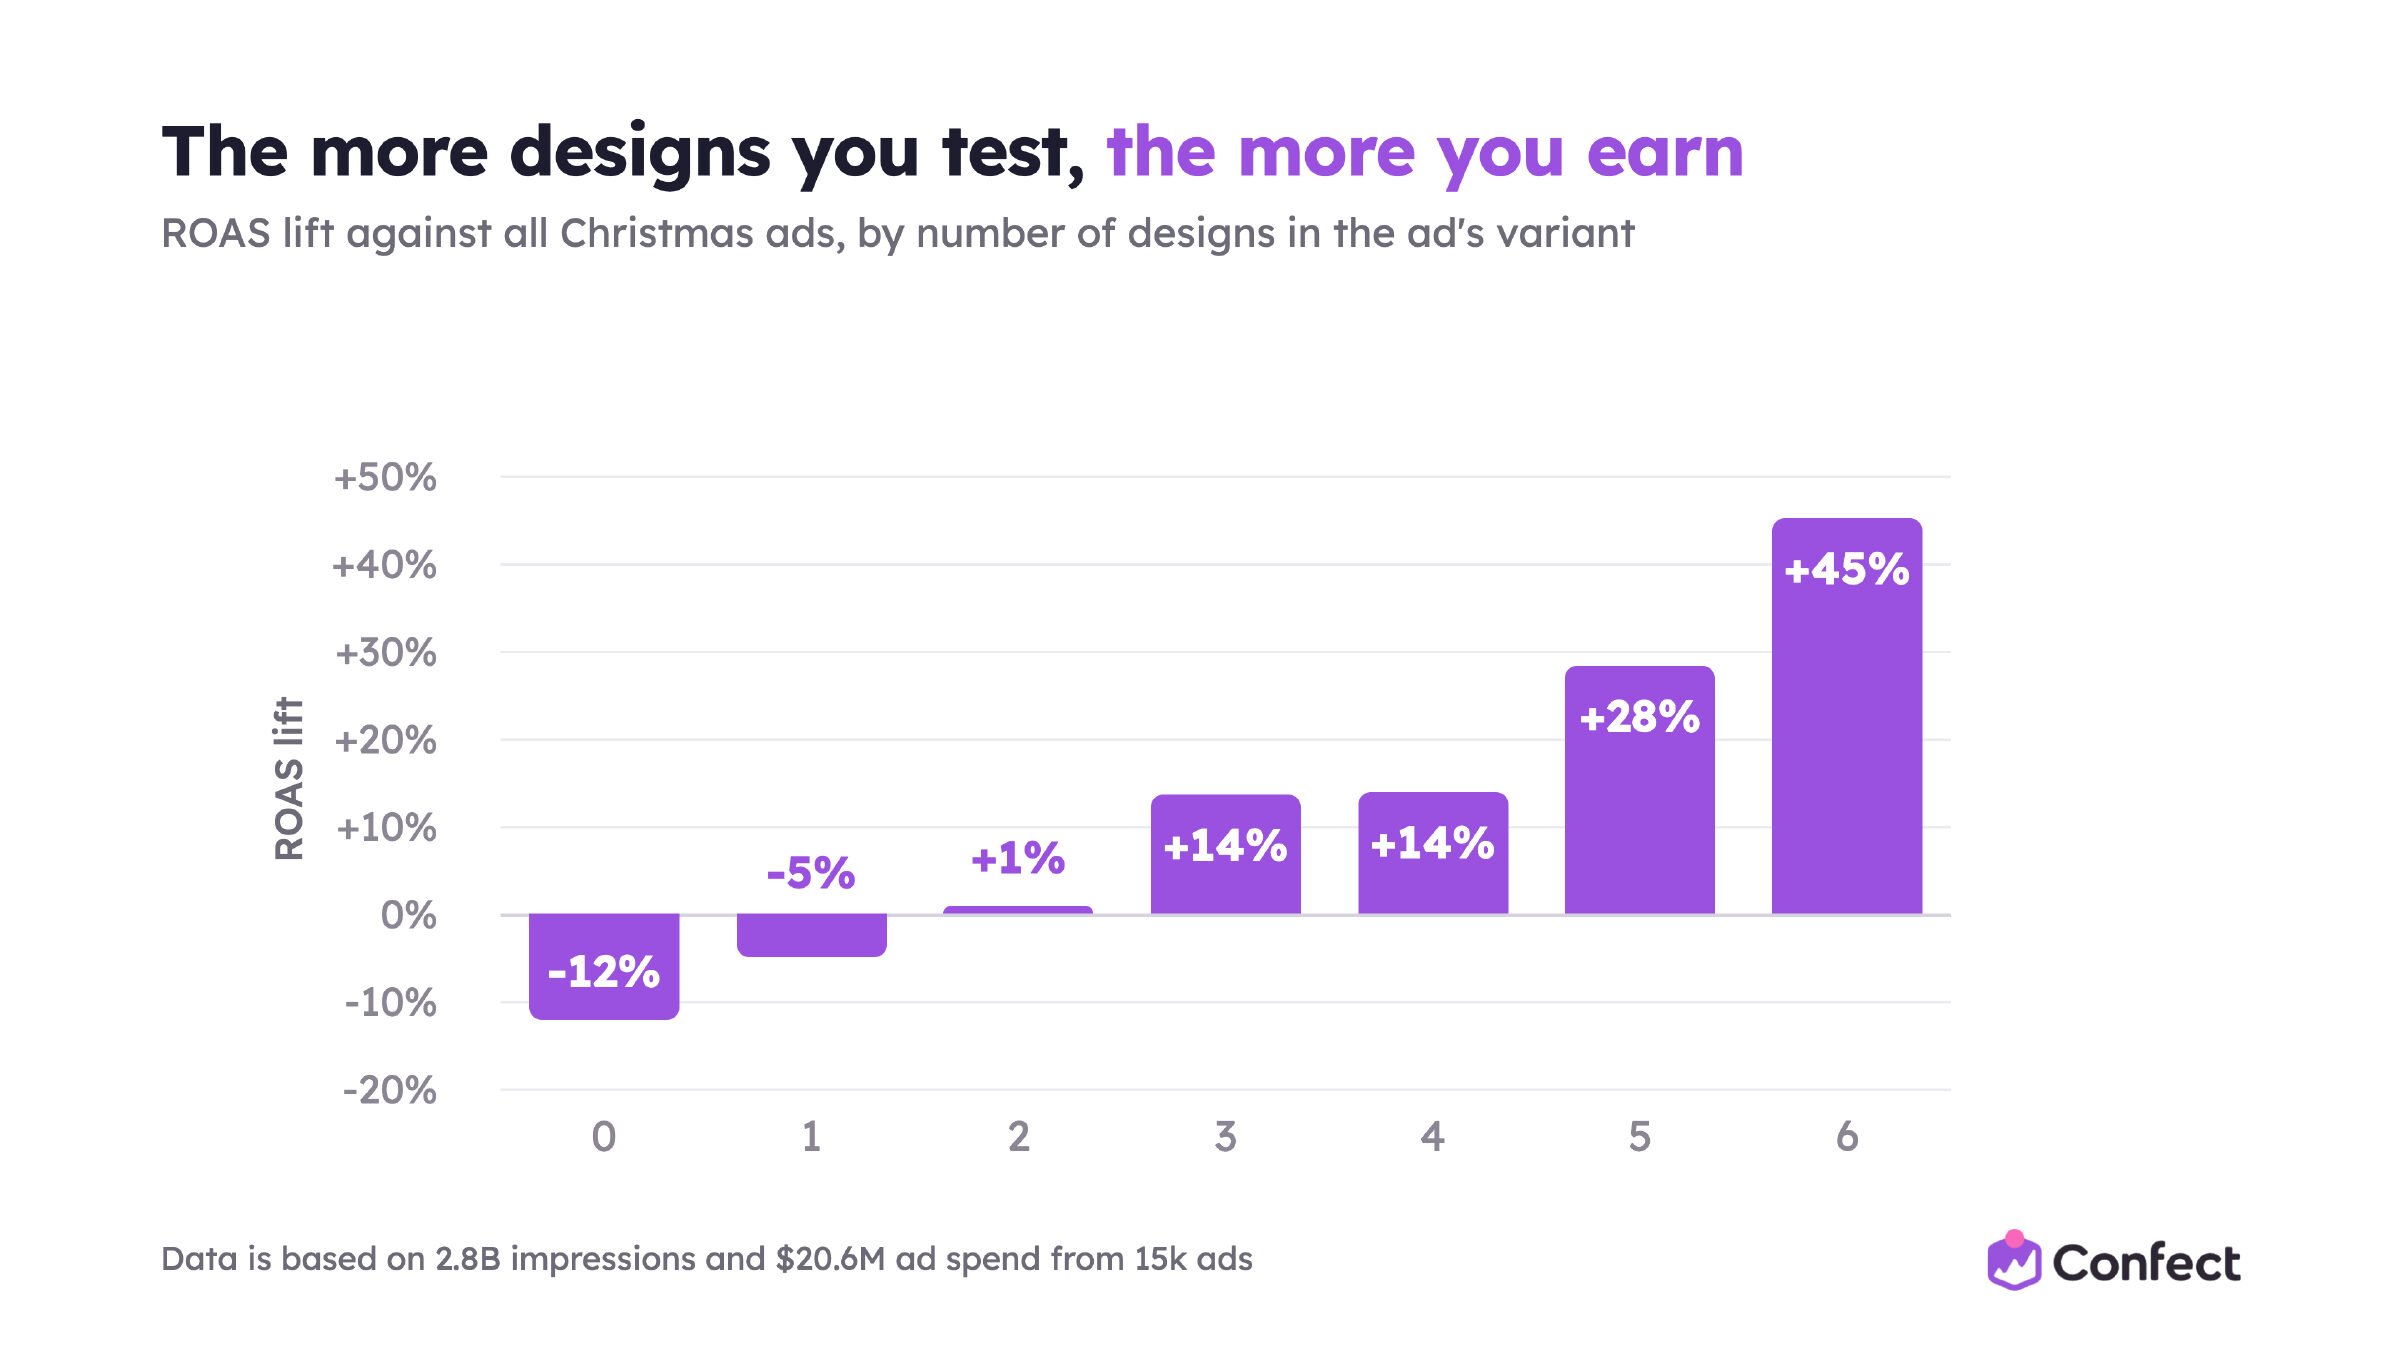
Everything above is an average across 1,332 shops. Social proof helps most shops at Christmas, but your shop is not most shops. The only way to know which elements work for your products and your customers is to run several versions and let December tell you. Six designs is not a lot of work in Confect. It is a lot of information.
Your Christmas 2026 playbook
Six moves, in the order you will need them.
- Keep spending on Catalog Ads when CPM rises. Shoppers click, convert and spend more, so ROAS still rises 25%. And if Catalog Ads are under a third of your Meta spend, this is the month to change that: advertisers above two thirds return 11% more.
- Run prospecting and retargeting side by side. Both return about 25% more at Christmas. Do not move the budget to retargeting alone. New shoppers pay off as well as returning ones.
- Consider vouchers and clearer calls to action. The call to action goes from +4% to +29% at Christmas, voucher codes from +27% to +40%. Tell the gift buyer what to do and give them a reason to do it here.
- Build trust into the design. Add ratings or reviews. Ads with them go from -6% to +18% at Christmas, while discounts matter less. If you are a small shop, this is your biggest lever: +36%.
- Keep your Product Assets. A brand logo or a gift badge attached to the product. Ads with Product Assets return 29% more at Christmas, as they do all year.
- Test many design versions. Ads with six designs in the variant return 45% more than the typical Christmas ad, ads with none 12% less. More versions also show you what works for your shop.
A rough calendar
- September to October: launch new products now, not in December. Check that the whole catalog is in your data source and eligible. Start or keep a traffic campaign running so you are on the shortlist when the gift hunt begins.
- November: run your Black Month designs. Prepare the Christmas designs in parallel: trust elements, a gift-oriented call to action, a voucher code if you use one, a gift badge as a Product Asset.
- 1 December: switch to the Christmas designs. Keep both funnels funded. Add shipping terms and delivery dates to the retargeting designs.
- Mid-December: update the call to action to the last order date. Shipping info in retargeting does most of its work in these two weeks.
- After the last shipping date: switch the call to action to gift cards or click-and-collect, or pause the shipping promise.
The dates are ours, not the data's. The data says what to show; your logistics say when.
Christmas Catalog Ads: frequently asked questions
Should I cut my budget when CPM goes up in December? No. CPM rises 21%, but click-through, conversion and order value rise too, and ROAS ends up 25% higher than in the average month. Cost per purchase actually falls.
Should I move everything to retargeting? No. Prospecting and retargeting both return about 25% more at Christmas, and retargeting pays the biggest CPM increase. Keep both.
Do discounts still work at Christmas? Yes, but less. Sale discount elements go from +26% in the average month to +9% at Christmas. Trust elements, calls to action and voucher codes gain more.
What is the one design change to make for Christmas? Add social proof. Ratings and reviews go from -6% to +18% at Christmas, and for small advertisers trust elements go with a 36% lift.
Does Christmas favour brands or retailers? Both gain. D2C brands gain 31%, multi-brand retailers 17%, and retailers already run the higher ROAS. They win with different design elements: brands with calls to action and vouchers, retailers with Product Assets and a logo.
Is December a good time to launch new products? Ads marking products as new still return 16% more than the typical Christmas ad, but 31% more in the average month. Launch in October and sell it as a gift in December.
How many designs should I run? As many as you can keep sensible. Ads with six designs in the variant return 45% more than the typical Christmas ad. More versions also tell you which elements work for your shop.
When should I start? October for product launches and traffic campaigns, November for building the Christmas designs, 1 December for switching them on.
How we measured this
The data. Catalog Ads on Meta made with Confect, December 2025: 15,229 ads from 1,332 advertisers, $20.6M in ad spend, $214M in revenue, 2.75B impressions and 1.70M purchases. The full-year comparison covers 147,000 ads, $463.5M spend and 70.1B impressions.
The periods. Christmas is December 2025. The average month is January to October 2025. Black Month (November) is left out of the comparison, so nothing here is Christmas against Black Friday.
Every advertiser counts equally. For each metric we take each advertiser's typical ad (the median), then the median across advertisers. Big advertisers with thousands of ads do not drown out small ones. That also means the numbers are medians, not sums: the groups do not add up to the total.
Qualified ads. Ads with at least $30 in spend. Ads with a ROAS of 100 or more are left out as outliers.
Two kinds of lift. Where we compare Christmas with the average month, the lift is the Christmas median against the average month median for the same group. Where we compare groups within Christmas (funnel, objectives, spend share, catalog size, number of designs, design elements by shop type and size), the lift is that group's median against all Christmas ads, or all Christmas ads in the same funnel, shop type or size.
Enough advertisers. Groups with fewer than 30 advertisers are not shown. Groups with 30 to 99 are shown but never carry a headline on their own. We say so in the text where a finding rests on a small group.
What counts as a difference. Under 5% is no difference. 5 to 15% is modest. Over 15% is a finding.
What this cannot tell you. We compare groups of ads, not controlled tests. Advertisers who use social proof may differ from those who do not in ways we cannot see. "Ads showing X returned Y% more" means exactly that, and not that X caused it. The one exception is Product Assets, which also holds when we compare ads within the same advertiser.